Round University Ranking: Principles of Classification and Calculation


Oleg Solovyev, Editor of Round University Ranking
Round University Ranking (RUR) is an international ranking of leading world universities published by RUR Ranking Agency (Moscow, Russia). The ranking provides comparison of 930 leading universities from 80 countries around the world for eight years (2010-2017) according to 20 indicators distributed into four areas: teaching, research, international diversity, and financial sustainability. Such a wide coverage, both geographically and temporally, makes the RUR ranking a unique tool for choosing universities for study and work as well as comparing higher education institutions on a global scale.
Principles and sources of ranking
The RUR rankings are based on inclusiveness, balanced and stable methodology as key principles of compilation.
FACT
RUR compared 930 leading universities from 80 countries around the world for eight years (2010‑2017) according to 20 indicators distributed into four areas: teaching, research, international diversity, and financial sustainability. In addition to the overall ranking, RUR includes 30 rankings on six subject areas: humanities, life sciences, medical sciences, natural sciences, social sciences, engineering.
Inclusiveness. There are no restrictions for any higher education institution in the world to limit their participation in the RUR ranking such as the number of publications, the availability of undergraduate programs, etc. The only exception effective as of 2016 is a number of restrictions concerning the initial indicators of universities: the number of academic staff, students, publications, etc. If a university does not reach these indicators, it is assigned the average value of the universities of the host country then. These restrictions are implemented to remove a number of anomalies from the ranking, which will be discussed below. It is worth noting that a university can participate in the ranking in any case, even though it does not overcome the threshold values.
Balanced Methodology. Initially, we proceeded from the concept that weights should be the same for all indicators of the ranking, i.e. 5% each. As testing made it clear, such approach led to anomalies in the ranking results (for more details refer to the International Diversity chapter). Thus, we found a compromise solution saying that the weights inside the measuring directions (groups of indicators) should be the same, so that no indicator had an advantage over the others. In so doing, the presence of a large number of indicators and small weights should minimize the volatility of the ranking.
Stable Methodology. The methodology of ranking, i.e. the number of indicators, the distribution of weights between them, and the initial data source should undergo minimal changes. Eight versions of the 2010-2017 RUR rankings had the changes but they were related to data processing methods and the elimination of the found anomalies rather than changes in the methodology basics.
- a navigator in the world of higher education enabling applicants and their parents to choose the appropriate higher institution and the way of training;
- a tool for students helping to choose a higher education institutions for their short-term programs or change their main place of study;
- a tool for teachers and professors enabling them to find suitable vacancies and make decisions about cooperation with their colleagues in the other universities;
- an assessment tool for the management of universities evaluating the competitiveness of a university on the national and global scale and making the appropriate management decisions aimed at comprehensive improvement of the university’s international competitiveness;
- one of the assessment tools for business evaluating the university and making decisions about cooperation with a particular higher education institution;
- a tool for the state to comprehensively assess the country's higher education system as well as a way of maintaining national prestige.
Traditionally, the rankings of the universities are represented by the so-called league tables. Within the framework of such type of rankings the data for individual metrics are reduced to a single score. This is a classical ranking, in which universities are evaluated by a number of parameters and are ranked according to the decrease of the final score. The final score is an aggregation (i.e. compilation) of scores for a number of indicators.
There is an alternative to league tables, i.e. the systems of comparison and correlation, which provide the clustering of higher education institutions according to similar characteristics instead of ranking. Thus, the ranking is no longer a ranking in the strict sense of the word. It rather becomes a set of indicators, which customers use to compare universities in accordance with their goals and objectives.
- What basic principles should be used as a basis for the methodology?
- Should the ranking be presented in the format of a traditional system of leagues or a system of comparison/correlation of the universities?
- What data should the ranking be based on?
Finally, it was decided to stick with the first option—a league table. First off, most of the rankings were built precisely on this principle, which makes this format familiar and understandable to users. Secondly, the system of user comparison in the strict sense is not a ranking because in this case each user has his/her own ranking. Thirdly, the team of RUR Ranking Agency counts to combine both approaches in the long term so that on the one hand, there will be the ranking as a league table, on the other, there will be introduced elements of comparison and correlation.
The procedure of choosing the data types used for the assessment of universities has become the key factor determining the methodology structure.
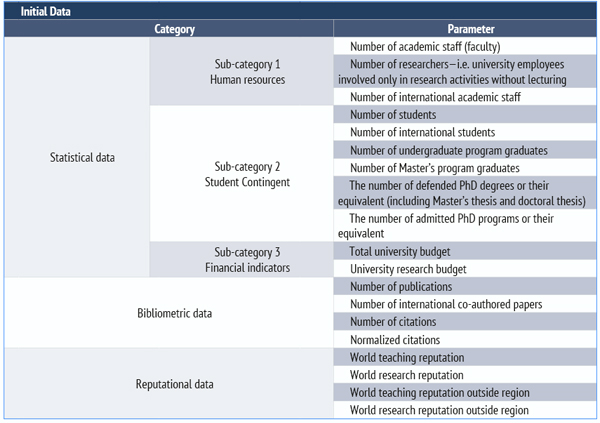
The main types of information to create a ranking are bibliometric data, statistics, and reputational data.
Bibliometric data are based on information obtained from bibliometric systems such as Web of Science Core Collection, Scopus, Google Scholar, etc. As a rule, the term bibliometric means the number of publications in scientific journals, the number of citations for these publications and all derivatives of those indicators. Scientometric data refer to the type of data most widely used in university rankings.
Statistics include the information provided by the universities, i.e. staff indicators (number of academic staff, researchers, etc.), data on the student population (total number of students, number of various diplomas/degrees awarded, etc.), financial data (total budget, R&D budget, etc.).
Reputational data are collected from specially conducted reputational surveys showing which universities respondents choose considering them the best in terms of the quality of teaching, research, etc.
After a careful evaluation we have chosen the Institutional Profiles by Clarivate Analytics, the former Thomson Reuters IP & Science Solutions.
The Institutional Profiles are an annually updated database containing all three abovementioned types of data. There are more than a hundred of unique indicators for each higher education institution within this database so it allows choosing appropriate indicators for any area of university activity.
Groups of measurement
The next task after selecting the data source is to define the methodology model, which is the basis for defining specific indicators and distributing the weights between them. This task is divided into three sub-tasks: (i) selection of measuring directions (groups of indicators); (ii) definition of the minimum and maximum limits of indicators for both the entire ranking and certain groups of indicators; (iii) determination of the weights of the groups and indicators.
The modern university is an extremely complex phenomenon and can include several campuses, hundreds of structural divisions, thousands and tens of thousands of employees, tens and hundreds of thousands of students. Universities are becoming the basis of scientific and technological clusters driving the growth of cities and regions. The mission of the university has long gone beyond the limits of teaching or presenting the knowledge by means of its translation, as it was in the Middle Ages.
Therefore, a natural question arises: how can we sort out and choose the key aspects of the universityʼs activity among the variety of the others and reflect them in the ranking methodology? It is worth taking into account that there is no ranking to be able to cover all aspects of the universityʼs activities since each university has its own unique features. Not to mention that some areas of activity are more amenable to quantitative accounting (scientific activity), the others are less (educational activities).
After a careful analysis of all possible areas of activity, we chose two main and two auxiliary directions of the universityʼs assessment. The main directions constitute the meaning of the institutionʼs activity and its basis. The auxiliary ones are supposed to measure additional, background aspects of activities. The main activities are Teaching and Research. The auxiliary activities are International Diversity and Financial Sustainability.
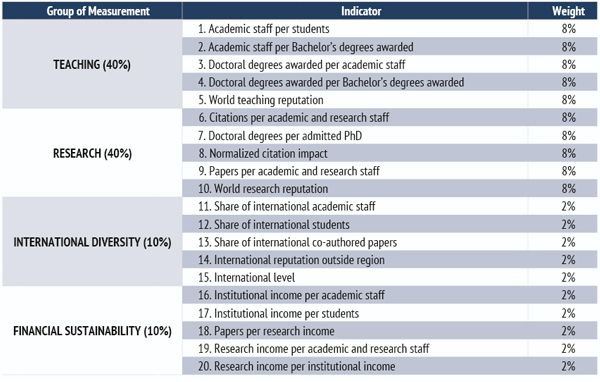
Based on the availability of the Institutional Profiles database, it was decided to choose five indicators for each of the four measured groups.
Taking into account that there are no scientifically based and universally accepted criteria for selecting weights of indicators, it is decided to assign equal weights within the indicator groups. Hence “Round,” the name of the ranking, comes, which denotes the symmetry of the methodology.
The International Diversity and Financial Sustainability groups are assigned 10% of weights. The weight of each criterion was 2% because there are five evaluation parameters.
Thus, 20% are distributed between two areas. The rest of 80% are left for the Teaching and Research groups.
We consider both Teaching and Research as two primary missions of every university. Therefore, the remaining 80% are equally divided: 40% for each of the two groups, and 8% for each of 10 indicators within these groups.
Summarizing the above we have come to the conclusion that the RUR ranking has the following structure: 20 indicators; four measured groups; five indicators in each measured group; and equal weights in the measured groups.
- 20 indicators;
- 4 measured groups;
- 5 indicators in each measured group;
- equal weights in the measured groups.
TEACHING (40%)
Teaching is one of the key missions of the higher education institution and at the same time it is the hardest activity to measure. For example, what is the correct way of evaluating professorʼs talent as a lecturer? Therefore, the only way to assess the quality of teaching in the global ranking is to use such formalized indicators as the number of academic staff divided by the number of students, etc. After careful selection we have chosen the following five indicators to be included in the Teaching area.
1. Academic staff per students (8%). This indicator shows how many faculty there are per student in a university. This is a standard indicator used in world university rankings due to objective reasons. As already mentioned, measuring the quality of education is one of the most difficult tasks in ranking universities. Using this indicator, we proceed from the assumption that the more lecturers there are per one student, the smaller the size of the student group is, and therefore the more attention a lecturer can pay to each student. This implies the conclusion that the quality of teaching is better in a group where there are five students per a lecturer than in another group, in which there are 25 students per a lecturer.
The initial values of the number of academic staff and students are calculated as reduced to the full time equivalent (for academic staff) or to the standard workload of the full-time student. Therefore, the number of academic staff and students in the RUR University Profiles may not correspond to similar values (“headcount”) found on the other resources.
2. Academic staff per Bachelorʼs degrees awarded (8%). This indicator specifies the number of academic staff per undergraduate degrees awarded in a given year. In fact, this indicator is a special case of the academic staff per students ratio and it measures undergraduate level programs.
The reason for allocating this indicator in a separate metric is that the level of baccalaureate is the basis of higher education in the world.
3. Doctoral degrees awarded per academic staff (8%). This indicator shows the number of PhD degrees awarded or its equivalent per academic staff. In other words, the indicator shows how many successfully defended dissertations are per a faculty on average. The more dissertations per academic staff are defended in the university in question, the higher level of teaching we can expect at the third stage of higher education, i.e. PhD.
4. Doctoral degrees awarded per Bachelorʼs degrees awarded (8%). This indicator shows the ratio of PhD degrees awarded to Bachelorʼs degrees awarded. This ratio reflects the proportion of the PhD programs compared to the programs of the first level, i.e. Bachelorʼs programs. The higher the proportion of PhD graduates is, the more the university is accordingly focused on the most complex and expensive level of training. A high percentage of PhD students in the total number of students shows that the university has a sufficient number of academic staff and researchers capable of preparing the PhDs as well as a sufficient amount of equipment and resources.
5. World teaching reputation (8%). The international reputation of the university in the field of teaching shows the degree of universityʼs fame in the international academic community. The initial data on reputation represent the distribution of respondentsʼ votes among universities. A special survey—Academic Reputation Survey—is conducted annually among representatives of the academic community to collect the reputational data. Participation in this survey is possible only by invitation. In other words, it is the survey operator who determines the initial sample of potential respondents who will receive an invitation letter to participate in the survey.
As part of the survey, a respondent is asked to select up to 15 universities, which he/she considers the most powerful in teaching. Annually about 10 thousand representatives of the international academic community participate in this survey around the world.
RESEARCH (40%)
The quality of the research conducted at the university is the second important group considered in the RUR ranking. Therefore, Research has as much weight in the overall ranking of RUR as Teaching. Most of the Research metrics are scientometric and are based on data from the Web of Science Core Collection bibliometric system.
6. Citations per academic and research staff (8%). This indicator helps to evaluate the intensity of the research conducted at the university. For this purpose, the number of citations of all universityʼs scientific publication authors for a certain period of time (different for the 2010-2015 and 2016-2017 rankings) is divided by the number of academic staff and researchers who worked at the university for a certain year. When counting the number of publications, only “Article” and “Notes” indexed by the Web of Science Core Collection bibliometric system are taken into account. “Scientists” are understood to be only those employees of the university who are engaged exclusively in research and development without being involved in teaching.
The version of this indicator in RUR 2010‑2015: the RUR 2010-2015 rankings counted only one-year publications, and the citation periods for the same publications were two years. For example, the RUR 2015 ranking used data on the number of university publications for 2012 and citations for the same publications for 2012-2013. The number of teachers and researchers was counted for 2012.
The choice of such a short time interval was determined by the need to give the ranking a greater dynamism due to a shorter period of counting bibliometric information. In 2016, it was decided to abandon the annual periods of counting publications and biennial ones for citations since the volatility of indicator scores was significantly higher than the periods when longer periods of counting bibliometric information were used.
The version of this indicator in RUR 2016: the 2016 version has five-year periods of accounting for publications and six-year periods for citations. The 2016 ranking has: (i) a period of accounting for publications: 2009-2013; (ii) a period of accounting for citations: 2009-2014; (iii) a year of accounting for academic staff and researchers: 2013.
7. Doctoral degrees per admitted PhD (8%). This indicator assesses the quality of the student preparation for the PhD level. For this purpose, the number of dissertations defended at a given university during the year under review is divided by the number of PhD programs and their analogues accepted for the first year. Thus, the average percentage of students defended PhD degrees is determined relative to those taken for the first year of education for educational programs at this level. A higher percentage, therefore, shows the organizational level of a PhD program and motivation of students. In addition, a high percentage of defended dissertations shows how a work system between academic staff and PhD students is built at the university. Conversely, the lower the defended/enrolled ratio is, the worse the motivation of students and the conditions of work at the PhD level are.
The version of this indicator in the subject rankings of 2016-2017: RURʼs seventh indicator in the subject rankings is stated as “The share of post-Bachelor students in the total number of students.”
This indicator measures the proportion of students enrolled in the first year of the Masterʼs program, PhD (and equivalent programs) out of the total number of students in this higher education institution. Since the Masterʼs programs and the PhDʼs in particular are predominantly research programs, then universityʼs contribution into the science of the future is assessed. The higher the percentage of students at the post-Bachelor level is, the more significant contribution to world science this university can make. Also, this indicator helps evaluate the human resources of the university. Accordingly, the higher the percentage of Masterʼs and graduate students is in the university, the more highly qualified scientific cadres the university should possess.
The change in the wording of the seventh indicator is due to the fact that since 2015 Clarivate Analytics has not collected data on the number of students admitted to the first year of PhD level programs at the subject area level.
8. Normalized citation impact (8%). The Normalized Citation Impact (NCI) shows the ratio of average citation of university publications per average citation in the world, type of publication and subject area for a similar time interval. For example, “the value of NCI is 1” means that the universityʼs scientific publications are cited in the same way as at the world average (100%). The value of 2.15 will show that the authors of the university are quoted as 215% of the world average, etc.
There are some differences between NCI for different years of the RUR ranking. The version of this indicator in RUR 2010-2015: the one-year periods of accounting for publications and two-year periods of citations were used to calculate NCI in 2010-2015 versions.
Such short periods were associated with the RUR analytical teamʼs original concept claiming that short periods would provide a certain dynamism to universities. On the one hand, it really happened. On the other hand, in a number of cases just a few publications could have an unjustifiably high influence on the final position of the university in the ranking. In this regard, it was decided to increase the counting intervals for both publications and citations in the following versions of the ranking.
The version of the indicator in RUR 2016: the 2016 version used the NCI sum for five periods: five-year periods for accounting for publications and six-year periods for citations according to the following scheme.
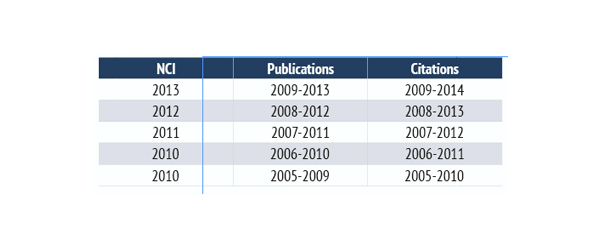
The version of this indicator in RUR 2017: for the calculation of the NCI indicator, publications for a five-year time interval and six-year period of citations of the same publications are calculated.
This scheme of calculating NCI seems to be the most stable. On the one hand, the counting periods are quite long, on the other hand, there is no artificial summation of NCI for several years as it was in the edition of the 2016 ranking.
9. Papers per academic and research staff (8%). This indicator shows the level of scientific productivity of the university. For this purpose, the number of scientific publications is divided by the number of academic staff and researchers working at the university during the last year when the publications were rated. Only “Article” and “Note” publications are considered.
The version of the indicator in RUR 2010‑2015: (i) the period of accounting for publications is one year (for example, publications of 2016 were rated in the ranking of 2015); (ii) the period of accounting for citations is two years (for example, citations of 2012-2013 were taken into account in the ranking of 2015).
The version of this indicator in RUR 2016-2017: (i) the period of accounting for publications is five years (for example: publications of 2010-2014 are rated in the ranking of 2017); (ii) the period of accounting for citations is six years (for example, the citations of 2010-2015 are rated in the ranking of 2017).
10. World research reputation (8%). The universityʼs reputation in Research shows the degree of influence that the studies conducted at the university have on the international academic community. In its original form, the reputation is the number of votes given for the university.
The reputational survey called the Academic Reputation Survey is conducted by Clarivate Analytics. On average, 10,000 respondents participate in this survey every year, leaving 60,000 votes for universities participating in the RUR ranking. The initial sample of respondents is formed on the basis of authors contacts indexed in the Web of Science Core Collection logs. Participation in the survey is possible only by invitation. In other words, any third parties, including universities themselves, cannot send Clarivate Analytics a list of participants recommended for the academic survey.
In the survey each respondent:
- selects one or more narrow subject categories, according to the classification scheme of the Web of Science Core Collection scientific categories;
- selects up to 15 higher education institutions, which he/she considers as leading in terms of the level of research conducted on the subject categories that the respondent indicated at the beginning of the survey.
The number of votes on the enlarged subject areas is used to compile the subject rankings of RUR. The total number of votes given for universities in all subject areas is used in drawing up the overall ranking, i.e. RUR World University Rankings.
INTERNATIONAL DIVERSITY (10%)
Internationalization of a university shows the degree of its involvement in the global educational and scientific process. This measurement gives 10% of weight against 40% of Teaching and Research.
The relatively low share of internationalization in the overall assessment of the university is due to the fact that, as a rule, universities are limited in their ability to influence the level of internationalization since this factor depends more on the geographical location of the university, on the overall standard of living of the country, in which the university is located, and on the policy pursued by the state in internationalization of higher education.
11. Share of international academic staff (2%). This indicator shows the level of academic staff internationalization at the university. To this end, the number of foreign professors and teachers (faculty) is divided by the total number of academic staff working at the university. Faculty is considered to be foreign, if their citizenship differs from the country where the university is located. In the case of dual citizenship, the priority is given to the citizenship of the home country. For example, if a join citizenship lecturer works at a university, and one of the citizenships coincides with the country where the university is located, and is native, then such a person will not be considered a foreigner.
The number of faculty is counted as the Full Time Equivalent of this institution.
The high level of internationalization of the university characterizes the work conditions of university academic staff and indirectly affects the conditions of studentsʼ education. The higher the university internationalization level is, the more attractive conditions for work are created in this institution, and the more diversity of views in the course of educational and scientific work can be expected.
12. Share of international students (2%). This indicator shows the share of students of foreign origin, students in the university on programs of three levels (Bachelorʼs, Masterʼs, postgraduate). Using this indicator, the attractiveness and competitiveness of the university for students from all over the world are assessed.
A student is considered foreign, if his/her citizenship does not coincide with the country where the institution is located. In the case of dual citizenship, priority is given to the country of origin. In other words, if a student studies in Country X and comes from Country X, but also has Country Yʼs citizenship, such a student will not be considered foreign to any institution in Country X. Сonversely, he will be treated as a foreigner in Сountry Y.
13. Share of international co-authored papers (2%). The indicator shows the proportion of publications with at least one foreign co-author in the total number of publications of the university. A foreign co-author is one of the authors of the publication who works in a country different from the country where the institution in question is located.
This indicator shows the scale of the universityʼs external relations, the degree of its involvement in the international academic community. At the same time, this indicator largely depends on the region and institution location country.
The version of this indicator in RUR 2010-2015: (i) the period of accounting for publications is one year (for example, publications of 2016 were rated in the ranking of 2015); (ii) the period of accounting for the citations is two years (for example, citations of 2012-2013 were taken into account in the ranking of 2015).
The version of this indicator in RUR 2016-2017: (i) the period of accounting for publications is five years (for example, publications of 2010-2014 are rated in the ranking of 2017); (ii) the period of accounting for citations is six years (for example, the citations of 2010-2015 are rated in the ranking of 2017).
14. International reputation outside region (2%). This indicator shows the reputation of the institution outside the geographical region of the universityʼs location. The list of regions is as follows:
- Asia;
- Europe;
- North America;
- Oceania;
- South America.
For example, if University X is located in Asia, then the voices given by out-of-Asia participants in the reputational poll for University X will be taken into account, i.e. the voices from the remaining five regions.
This indicator is a special case from the global reputation, which takes into account the universityʼs votes from around the world, including the region where the institution is located.
The reputation of the university outside the region is highlighted in a separate indicator because the reputation obtained from “oneʼs own” region can show a significant percentage of votes from the total number of votes given for the university.
The version of this indicator in RUR 2010‑2015: only reputation in Teaching outside the region is taken into account.
The version of this indicator in RUR 2016‑2017: the average value (the number of respondentsʼ votes) of reputation in both Teaching and Research outside the region is taken into account.

15. International level (2%). This indicator shows the overall level of institution internationalization and the average for indicators 11-14.
The version of this indicator in RUR 2010‑2015: International Bachelors (2%)—the indicator with this wording is relevant for the 2010-2015 rankings. By means of this criterion, the proportion of foreign students who are enrolled in the first year of Bachelor-level programs is determined. This indicator was singled out in a separate metric despite the seemingly similar resemblance to the “foreign students” indicator because higher education at the Bachelorʼs level has the largest share among all levels of education.
The version of this indicator in RUR 2016‑2017: International level. In the 2016 ranking the previous indicator was replaced by the current version, i.e. the average score of indicators 11-14 due to Clarivate Analytics stopped collecting information on the number of foreign students admitted to undergraduate programs and our partner in data collection and processing.
FINANCIAL SUSTAINABILITY (10%)
High financial capabilities of the university are one of the indispensable conditions for quality education and research. At the same time, the financial indicators of the university largely depend on the overall economic level of the country where the university is located. That is why, despite the objective significance of financial indicators for the development of the university, this indicator has 10% of the final assessment of the university, along with International Diversity. When calculating information on all financial indicators, both public and private investments in the university are taken into account.
16. Institutional income per academic staff (2%). This indicator shows the institutional income per academic staff ratio (faculty). When calculating the total budget, all incomes that the university received from all types of sources (both state and non-state) for a fiscal or calendar year are taken into account.
As follows from the description, this indicator is normalized, i.e. it is a ratio of total budget to the faculty is taken into account rather than overall budget of the institution. This equates the opportunities of both large and small universities.
17. Institutional income per students (2%). This indicator calculates the level of university funding per student.
18. Papers per research income (2%). This indicator shows this number of publications concerning the university budget allocated for research. In other words, the average cost of a publication is measured, which, in turn, shows the financing level of the universityʼs scientific activity per one unit of the final product—a publication in a prestigious academic publication.
The version of the indicator in RUR 2010-2015: the period of accounting for publications is one year (for example, publications of 2012 were rated in the ranking of 2015).
The version of this indicator in RUR 2016‑2017: the period of accounting for publications is five years (for example, publications of 2010-2014 are rated in the ranking of 2017).
19. Research income per academic and research staff (2%). This indicator evaluates the relative funding of the scientific activity of the university. For this purpose, the total amount of the research budget is divided by the number of academic staff and researchers in the university (academic staff).
We do not use “the number of researchers” as the only one (i.e. the university staff who are involved only in research activities) because the understanding of “a researcher” differs in the countries all over the world. Thus, the denominator uses the number of both academic staff and researchers staff.
20. Research income per institutional income (2%). The share of the research budget in the general budget of the university shows the degree of university orientation for carrying out advanced research. That, in turn, also affects the level of teaching at the university. The higher the share of investment in research is, the higher the level of the educational process is expected at the university due to getting students and the academic community involved in research. Thus, with help of this metric, the level of both teaching in the university and research are assessed.
Calculation stages
The seemingly clear and simple values of the ranking—points and ranks of universities—are based on a long and elaborated multi-stage data processing. All the stages of data processing in the RUR ranking are listed down below.
Step 1. Processing the initial ranking data. The initial data array is not yet the basis for calculating scores of indicators, i.e. primary information, which, in turn, is used to calculate scores of various types of rankings existing within the system of RUR rankings.
The main problems of the ranking initial data are missed data, abnormal values, and the specificity of national educational systems.
1) Missed data. Not all universities provide the data in the amount required for calculating the ranking. Therefore, there are gaps appearing in the initial data.
2) Abnormal values. The institution can provide abnormally high or low values by mistake. For example, financial indicators can be introduced instead of the number of students.
3) The specificity of national educational systems can lead to unintentional distortion of information. For example, there are the so-called undivided degrees in a number of countries, i.e. the educational programs lasting 5-6 years awarded with a Specialistʼs degree equivalent to Masterʼs degrees. Therefore, universities with dominating educational programs at the Specialistʼs level can indicate a small number of the Bachelorʼs degrees awarded, which leads to abnormally high values in the ranking indicator using the number of the Bachelorʼs degrees awarded.
Step 2. Raw data processing. The rules below are relevant for the subject rankings of RUR 2016, the general ranking of RUR 2017, and all subsequent rankings. These rules are not applied to the subject rankings of 2014-2015 and general rankings of 2010-2015 (except for the first one).
1) Testing for abnormal values. Each data array is tested for abnormal values. For this, each array of initial parameters is evaluated in the manual mode. If a higher education institution has abnormally high or low values,
such values are checked again by sending inquiries to those universities as well as by gaining data from the third parties.
2) Clipping indicators. The threshold values are introduced in order to minimize the effect of the anomalous values that occur at the stage of calculating the relative data from the initial data. If actual values for a number of indicators are less than the threshold values listed below, then for all relative indicators of the ranking, in which these absolute values are used, the institution is assigned 25% of the universities average in the country where the institution is located. If the only institution represents a country in the ranking, then this institution is assigned 25% of the world average by the corresponding indicator.
The thresholds by indicators are as follows:
- academic staff—50;
- students—200;
- bachelorʼs degrees awarded—50;
- degrees awarded—20;
- publications—50.
For example, if University X has 170 students, then according to the academic staff per students indicator this university is assigned 25% of the average number of students in the country where it is located.
3) Data omissions. If a university does not have any initial value, then it is assigned 25% of the average value of the country. If there is only one university in the country, then this institution is assigned 25% of the world average.
4) Bachelorʼs degrees awarded. If the share of Bachelorʼs degrees awarded is less than 5% of the total number of students, the actual value of the institution according to the initial parameter of “Bachelorʼs degrees awarded” changes by 50% of the national average. This is done so that universities with undivided degrees did not receive a significant advantage in calculating the scores of those ranking indicators that use the number of Bachelorʼs degrees awarded.
5) The exclusion of universities from the ranking provided that there are no input data (this rule is relevant for ranking versions).
In the 2010-2016 rankings the university was excluded from consideration, if the data missed on more than: (i) five initial parameters in the 2010-2015 rankings; (ii) seven initial parameters in the rankings of 2016, subject rankings of 2017 and subsequent years.
In RUR World University Ranking 2017 this rule does not apply. In other words, all universities participate in the general ranking from 2017 on regardless of how much data is missing in the university initial source.
Step 3. Relative values calculation. After preparing the initial data set, relative data are calculated from absolute ones (i.e. the number of academic staff, students, publications, citations, etc.). Relative values are a product of two values. For example, if we need to get the value for the academic staff per students indicator, the number of academic staff is divided by the number of students. But not the other way around.
Of the 20 indicators, RUR-relative values are used in 15 cases out of 20. In the remaining five cases, the absolute values are transferred unchanged to the relative category. These are the following values:
- world teaching reputation;
- normalized citation impact
- world research reputation;
- world reputation outside region;
- international level.
Step 4. Scores calculation. After the preparation of an array of relative data, the calculation of scores on 20 ranking indicators begins. To do this, the relative data array is ranked from the largest to the smallest. After that each university has a percentile assigned on 20 arrays of relative values, i.e. a value on a 100-point scale based on the rank (number) of the university and the size of the sample. For example, if there are 1,000 universities in the sample, then the higher education institution with the highest score gets 100 points, the second university does 99.9 points, etc. Thus, the percentileʼs “step” is obtained, which depends on the size of the data sample.
There are two additional rules applied at this step.
1) Repeating Relative Values. If a number of relative values is repeated, then all HEIs with the same values are assigned average percentiles. For example, the last 50 universities in a 1,000-institution sample have the same values. These universities are assigned from zero to five points. The average value is 2.5. Thus, each of the 50 universities is assigned 2.5 points. As a rule, reputation indicators contain a lot of identical values.
2) Calculation of international level indicator. This rule is relevant only for the rankings from 2016 on. The international level is the only indicator whose score is calculated not from relative values, but from the average score. In this case, the average of the four indicators of the International Diversity group is calculated.
Step 5. RUR World University Rankings scores and positions calculation. The scores assigned at the fourth stage are converted to the university final score, which is used to rank universities and finalize the universities ranking.
Scores of ranking indicators are multiplied by weights. In RUR this is either 8% or 2%. The results are summarized. Universities are ranked on the basis of the sum of universities score products and weights. At this stage, the ranking is ready. University scores are listed on a 100-point scale. For this purpose, the highest absolute score is assigned to be equal to 100 points. The other institutions scores are considered in proportion to 100 points. The ranking is ready.
LEAGUES
Diamond League (1-100)
The Diamond League shows professionalism and the highest quality of both research and education. Universities presented in the Diamond League demonstrated themselves as world’s centers of excellence and competence. In this league one can find both centuries-old universities whose history counts more than 500 years and young participants who barely reached the 50-year mark. To get into the Diamond League universities should obtain equally excellent education and research scores, have a high level of internationalization and demonstrate strong financial sustainability.
Golden League (101-200)
The noble metal is for the RUR members that got the second place in the league distribution. Universities included in the Golden League are equally strong both in education and teaching fields, with a focus on one of them, and are equally high-internationalized and financially sound.
Silver League (201-300)
The third step in the RUR system is the Silver League. Universities included in this league tend to have a pronounced component: either research or teaching.
Bronze League (301-400)
The Bronze League unites the universities of the fourth hundred. To be counted as a part of the league the university should get into the third quartile on main RUR indicators and get into the second quartile in the International Diversity and Financial Sustainability groups.
Copper League (401-500)
The fifth league is Copper. It completes the series of the so-called colored or metal leagues. Higher education institutions included in the Copper League close the prestigious Top-500 in RUR Rankings. Universities from this league can be considered as elite, because they are in the top 2-2.5% of world universities.
World League (501+)
The World League unites universities from all countries that pursue excellence. The goal of World League universities is to get into Top-500 by strengthening their positions. The World League may be called a reserve bench pressing forward on to Top-500 leaders.
Step 6. Calculation of scores and positions by measured groups. Rankings by measured groups (Teaching, Research, International Diversity, Financial Sustainability) are calculated as follows. Each ranking by measured groups has five indicators from the indicator group with the same name. When calculating the absolute score of the university, the common weight of 20% is used for all rankings in the measured groups.
Step 7. Calculation of subject rankings. RUR Subject rankings are calculated similar to the basic, general rankings.
The only difference is the first indicator of the Research group. The post-Bachelor students per the total number of students indicator is used instead of the doctoral degrees awarded per admitted PhD indicator.
In other respects, the stages and algorithms for calculating the subject rankings are identical to the algorithms for calculating the overall rankings.
RUR Classification
Within the RUR Rankings System all higher education institutions are classified by leagues, dimensions, and subjects.
Leagues. The world of higher education is diverse and, to emphasize this diversity, we have introduced a system of the so-called Leagues.
Each of the approximately 20,000 universities of the world is unique: one is a global research hub that brings together leading scientists in one place, another focuses on training staff for a necessity of a particular region within the country, while the third aims for teaching middle managers of global companies, to whom the university is an additional boost for career development.
DIMENSION AREAS
Overall
Rankings of leading world universities are conducted on the basis of four areas of activity—Teaching, Research, International Diversity, and Financial Sustainability.
Teaching
Education is commonly underestimated in global university rankings. There is a natural explanation for this—it is very difficult to quantitatively measure the quality of teaching. Anyone who measures the quality of education must operate with quantitative ratios. Teaching is the cornerstone of higher education and, more broadly, education in general.
Research
Research is also an important component of a university, it is a key feature of a university as well as Teaching. This area is related to research productivity, measured on the basis of scientometrics data.
International Diversity
In a global world, the ability to attract students and teachers from other countries means more than ever. A high level of internationalization shows how attractive a university is and consequently how competitive it is in the global arena. However, internationalization largely depends on the overall circumstances in a given country and universities are unable to change these conditions. In short, internationalization is more dependent on a country's culture and politics rather than on the university.
Financial Sustainability
This group shows the financial position of a university and determines the degree of involvement of the university in the real economy, its ability to attract investment from industry. Financial stability in a global economy is important for universities since they are a part of global economy.
Despite of the variety, the universities are united by their commitment to excellence. In order to emphasize this commitment we have introduced a system of the Leagues, resembling the Olympic medals system.
Each league embraces a hundred of universities (the first, second hundred and so on):
- Diamond League (Rank 1-100)
- Golden League (Rank 101-200)
- Silver League (Rank 201-300)
- Bronze League (Rank 301-400)
- Copper League (Rank 401-500)
- World League (501+)
We note that our task is to show the diversity of higher education institutions on the basis of a simple statistical method of distributing objects to clusters. The Leagues represent the universitiesʼ desire for progress
and perfection.
Dimension areas. Several groups of measurement and individual rankings exist within the RUR ranking. In addition to the Overall Ranking, higher education institutions are evaluated by four areas: Teaching, Research, International Diversity, Financial Sustainability.
In contrast to the Overall Ranking, the single-area rankings allow to reveal universityʼs strengths and weaknesses in certain fields, not just in general.

Subject areas.University rankings serve a variety of functions, one of the most common is being a source of information. The Overall Rankings give us a picture that can be used for comparing whole universities. Subject rankings allow for comparing university activity in a specific or few specific areas. If one is interested in analyzing a university by specific subject areas throughout the world, the Subject Rankings are an ideal way to do so. Using our system of indicators, users will be able to compare programs in details. These comparisons will allow users to obtain subject-specific information.
RUR provides the rankings in six broad subject areas: Arts & Humanities, Life Sciences, Engineering & Technology, Medical Sciences, Social Sciences, and Natural Sciences.
The complex and multi-variable nature of worldwide university rankings demands a multidimensional view. Rankings provide tools for analyzing universities to get a clearer picture of university activity throughout the world. RUR Rankings Agency believes that its objective system has made that picture a bit clearer for both academic community and students.
SUBJECT AREAS
Arts & Humanities
This subject area includes such disciplines as history, philosophy, philology, etc. Humanitarian sciences are traditionally underestimated in university rankings. On the contrary, the ranking which is solely focused on humanities can illuminate this subject area better than general rankings.
Life Sciences
The subject ranking provides insights into the highest rated universities for life sciences. The subject area includes biology, biomedicine, bioinformatics, etc.
Engineering & Technology
This subject ranking marks out top universities in the area of Engineering & Technology. Apart from engineering disciplines, this subject area includes all kinds of IT disciplines, robotics, telecommunications, etc.
Medical Sciences
The current subject ranking provides a list of the best universities for Medical Sciences throughout the world. All medical related disciplines are included in this area: oncology, dermatology, nursing, etc.
Social Sciences
This subject ranking provides information on the best universities’ offerings in Social Sciences programs. This subject area unites subject categories devoted to the humanities and social studies: law, social work, linguistics, international relations, etc.
Natural Sciences
This ranking presents the top universities for the Natural Sciences subject area. Natural Sciences unify such disciplines as physics, mathematics, chemistry, geography, etc.