Higher education and research in Germany
Higher Education DiscoveryОбщество с ограниченной ответственностью «Редакция журнала «Аккредитация в образовании»Global education
by DAAD
Annotated charts on the German higher education and research system
The bilingual online publication offers a concise summary of figures and charts on Germany’s academic and scientific landscape.
Likewise, the reader finds conclusive information on the structure of the education system including the different types of higher education institutions, as well as numerous portraits of relevant organisations from science and research. Data sources of statistical data in graphical representations and texts, such as the Federal Statistical Office, the Federal Ministry of Education and Research, the annual DAAD publication “Wissenschaft weltoffen” and statistics of other organizations. The publishers of the numbers can be found in the graphics below; detailed references in the appendix.
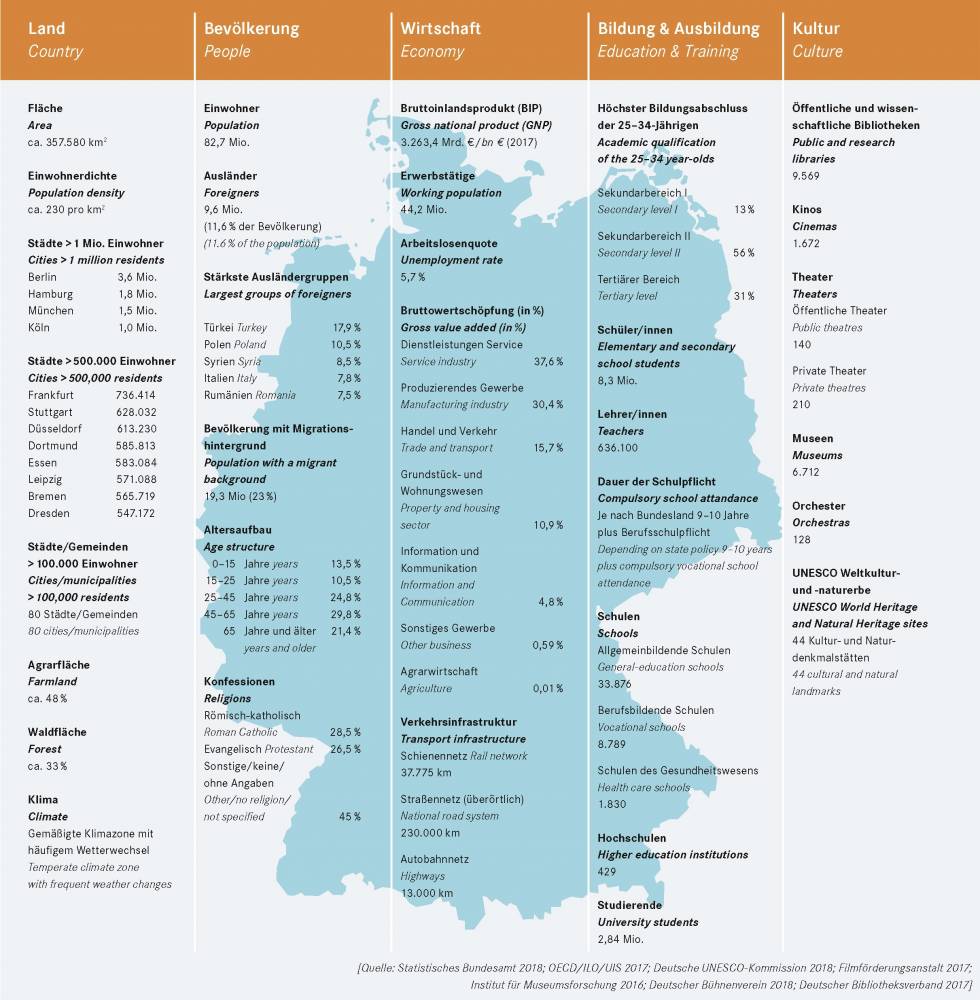
1. Facts and figures about Germany
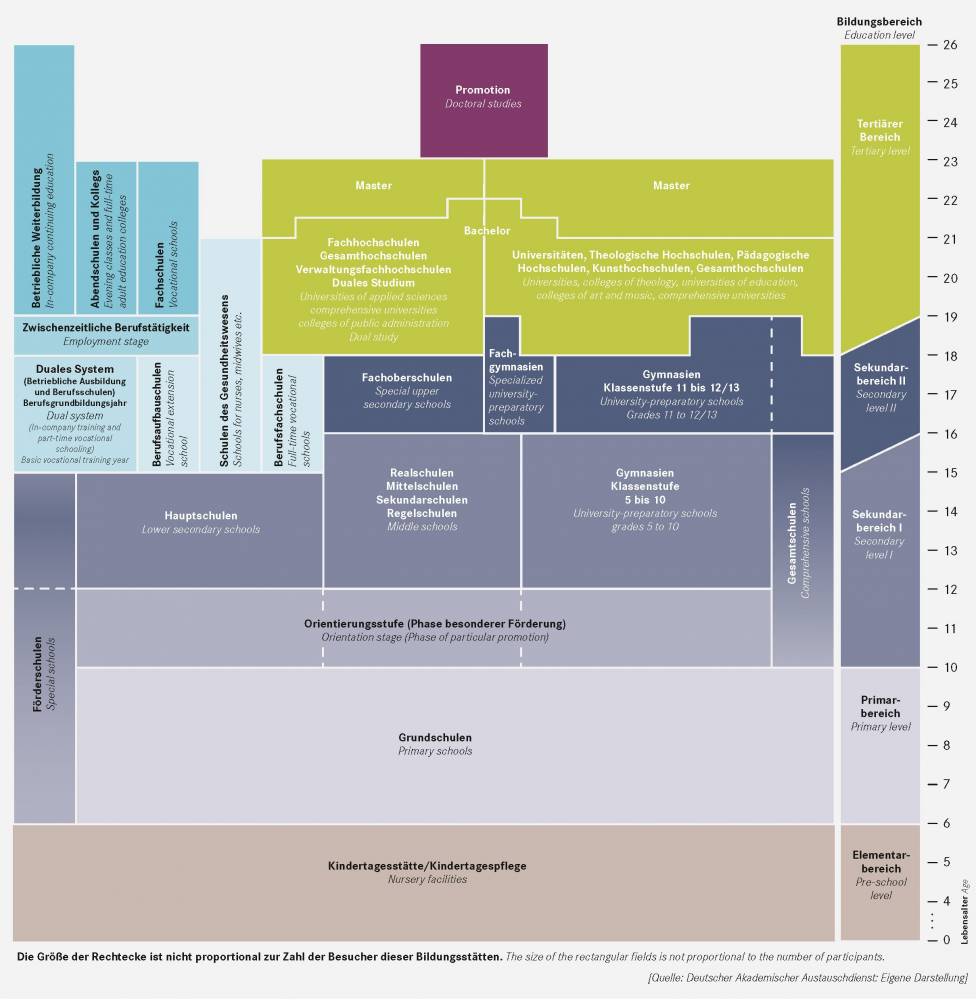
2. Basic structure of the education system of Germany
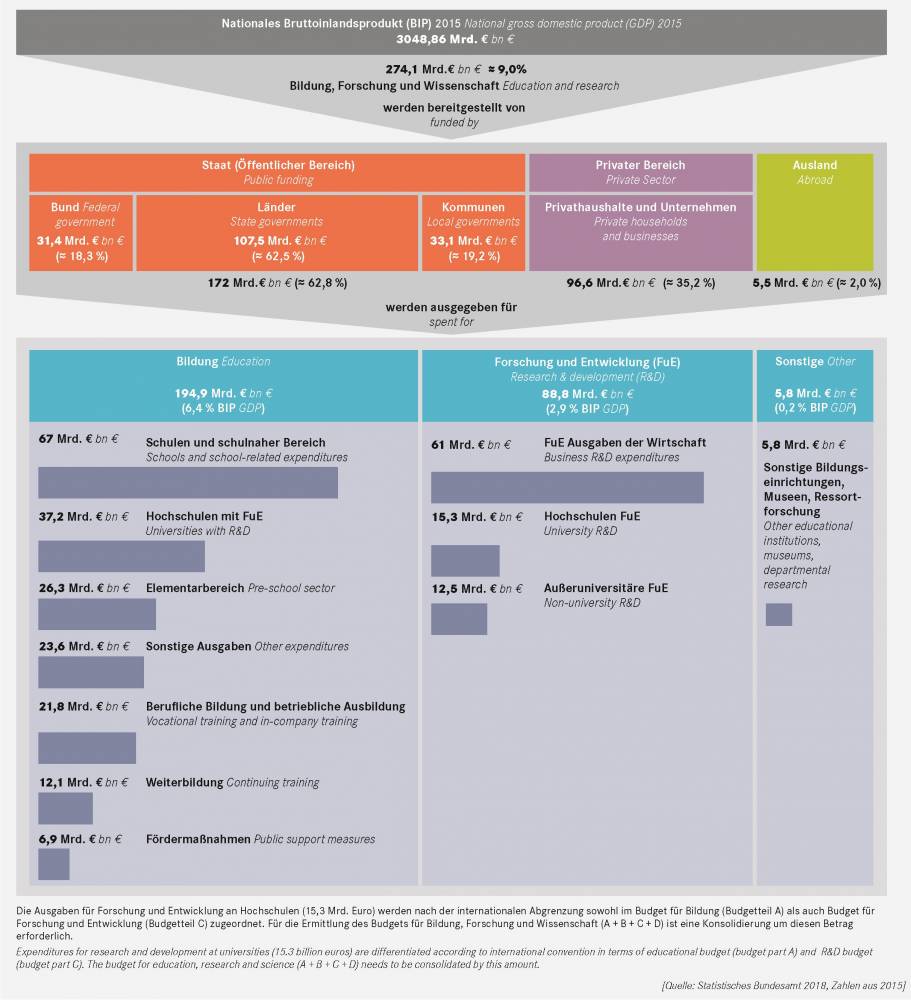
3. The national education, research and science budget
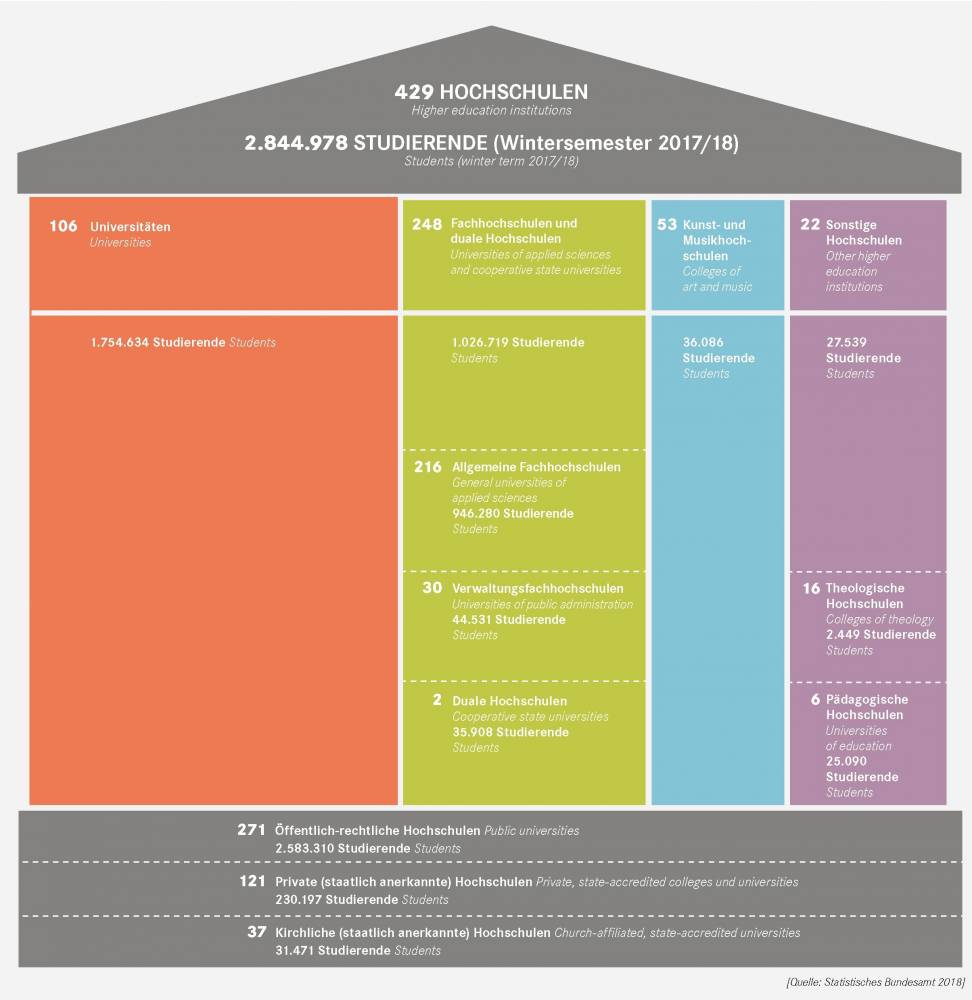
4. Types of higher education institutions
5. Differences between universities and universities of applied sciences
6. Public, private and ecclesiastical higher education institutions
7. Size of German higher education institutions
8. Founding dates of the largest German higher education institutions
9. German higher education institutions and degree courses abroad
10. Undergraduate admission to German universities
11. The structure of university study
12. The social dimension of university study
13. Government financial aid for students 2017/18 (BAföG)
14. The increase in the student enrolment since 1960
15. Who studies what? The distribution of subject groups in the winter term 2017/18
16. Foreign students enrolled at German universities and universities of applied sciences
17. German students studying abroad
18. Erasmus+ Countries of origin and host countries of German and foreign students
19. Doctoral study
20. Habilitation − The route to becoming a university professor
21. Staff at higher education institutions
22. Proportion of women at German higher education institutions
23. Foreign academic staff in Germany
24. Exchange of visiting researchers between Germany and other countries
25. The government and universities – Responsibilities, governance and cooperation
26. The dual funding of university-based research
27. The German research landscape and how it is funded
28. The Excellence Strategy
29. The positioning of German universities in the most influential international university rankings (Top 200)
30. German Rectors’ Conference
31. The German Academic Exchange Service
32. The Alexander von Humboldt Foundation
33. The Goethe-Institute
34. The German Research Foundation
35. The Max Planck Society
36. The Helmholtz Association of German Research Centers
37. The Leibniz Association
38. The Fraunhofer-Gesellschaft
References of data and information for charts
1. Facts and figures about Germany
Germany is located in the centre of Europe, bordering on nine other countries. Reunified in 1990, the country is the European Union’s most populous member state and its strongest economy. Germany’s federalism has produced a diverse array of smaller and mid-sized economic and cultural centres throughout the country. Decentralisation continues to be a defining feature of Germany, which is divided into 16 semi-independent states.
Education and culture are among the most important policy areas that fall under state jurisdiction, and public universities in Germany are run by the states.
2. Basic structure of the education system of Germany
Education in Germany is the responsibility of the 16 states. The general structure shown above may therefore vary from one state to another. Some of the characteristics shared by all German states include:
- the tripartite structure of general schooling following fourth or sixth grade (with pathways into the university-preparatory Gymnasium, most importantly after completing tenth grade);
- the importance of the dual system of vocational education and training, which combines classroom learning at vocational colleges with on-the-job training;
- the division of the tertiary sector into universities and universities of applied sciences − a distinction that has been losing some of its significance, however, due to the structural reforms of the Bologna Process.
3. The national education, research and science budget
The German national budget for education and research from 2009 to 2015 comprised about 9 % of the annual gross domestic product. Nearly twothirds of the budget are financed by the public sector (federal, state, local authorities); more than one-third comes from the business community (mostly in the areas of vocational training and R&D investments) from the private sector and abroad. Government spending is mainly borne by the states. The federal government and the municipalities each finance one-fifth of the state education expenditure.
4. Types of higher education institutions
Germany has a diversified system of higher education, in which universities and universities of applied sciences are most prominently represented. Likewise, significant differences in terms of size, profile, and reputation exist among institutions belonging to the same type. The group of universities, for example, share the privilege of granting doctoral degrees and uphold the unity of teaching and research. These include universities of technology, comprehensive universities, and universities offering a limited range of subjects. In addition, the “cooperative state university” is becoming more prevalent in Germany's higher education sector as a form that combines dual vocational education and university study.
5. Differences between universities and universities of applied sciences
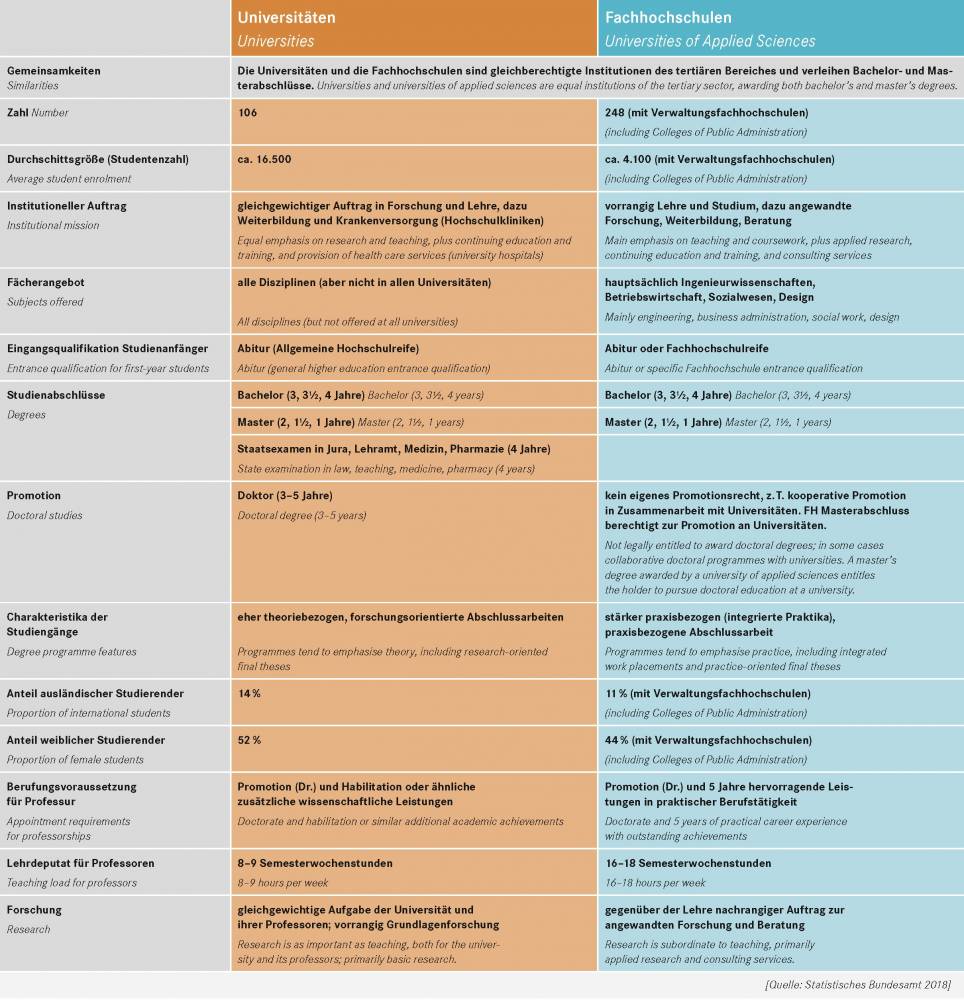
Although 60 % of all German universities are universities of applied sciences, only about 35 % of the total student population is enrolled at these institutions. This is mainly due to the limited (but increasingly expanding) range of subjects they offer. In their core disciplines (engineering, economy, social matters), by contrast, universities of applied sciences produce more graduate students than their university counterparts. The differences shown above are becoming increasingly less pronounced, however, as a result of the Bologna Process. The single most important difference that will remain is the universities’ “doctoral degree-granting monopoly”; but new models of cooperation are emerging in this area as well. A student graduating with a master’s degree from a university of applied science is entitled to register as a doctoral candidate at a university.
6. Public, private and ecclesiastical higher education institutions
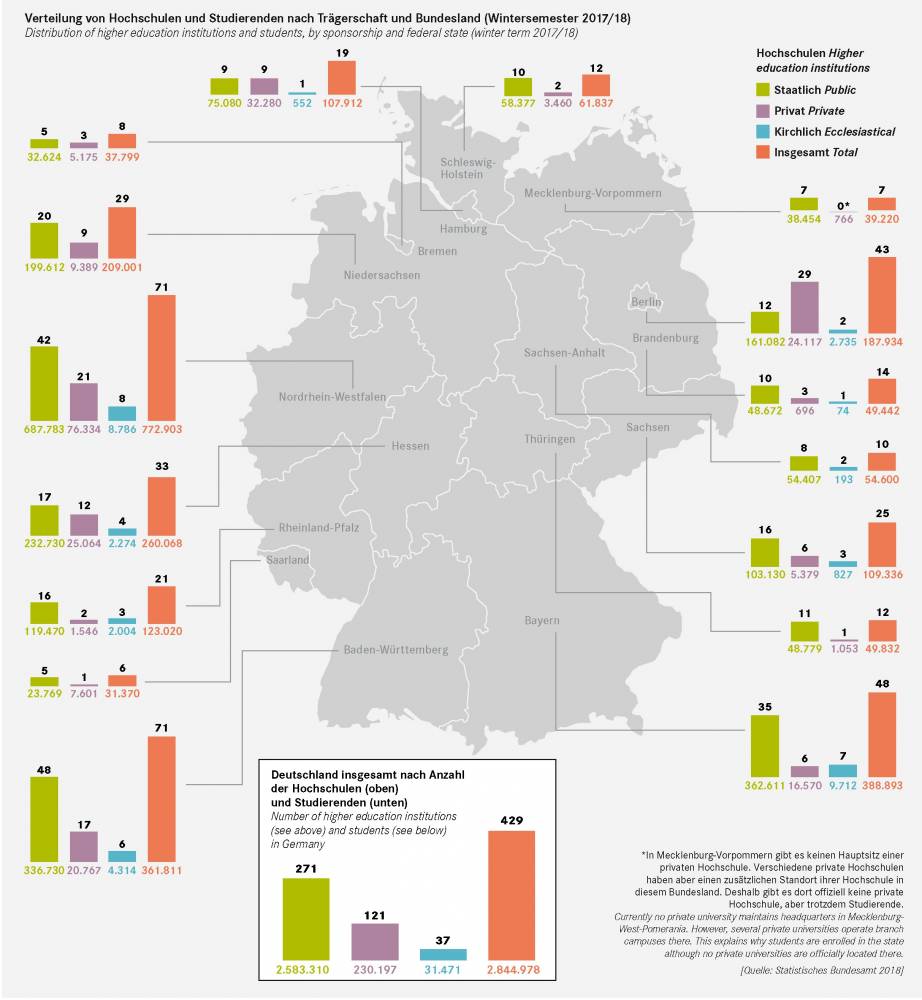
More than 60 % of German universities are subsidised by public or state authorities, meaning that they are financed by the public sector. Only about 28 % of all universities are privately funded. Almost 9 % are church-financed.
More than 90 % of students are enrolled at state universities. This indicates that state universities attract by far the greatest number of students, unlike in many other countries. In contrast, private universities often attract students who wish to specialise, study in smaller groups, or who have not been able to gain admission to a state university due to admission restrictions.
7. Size of German higher education institutions
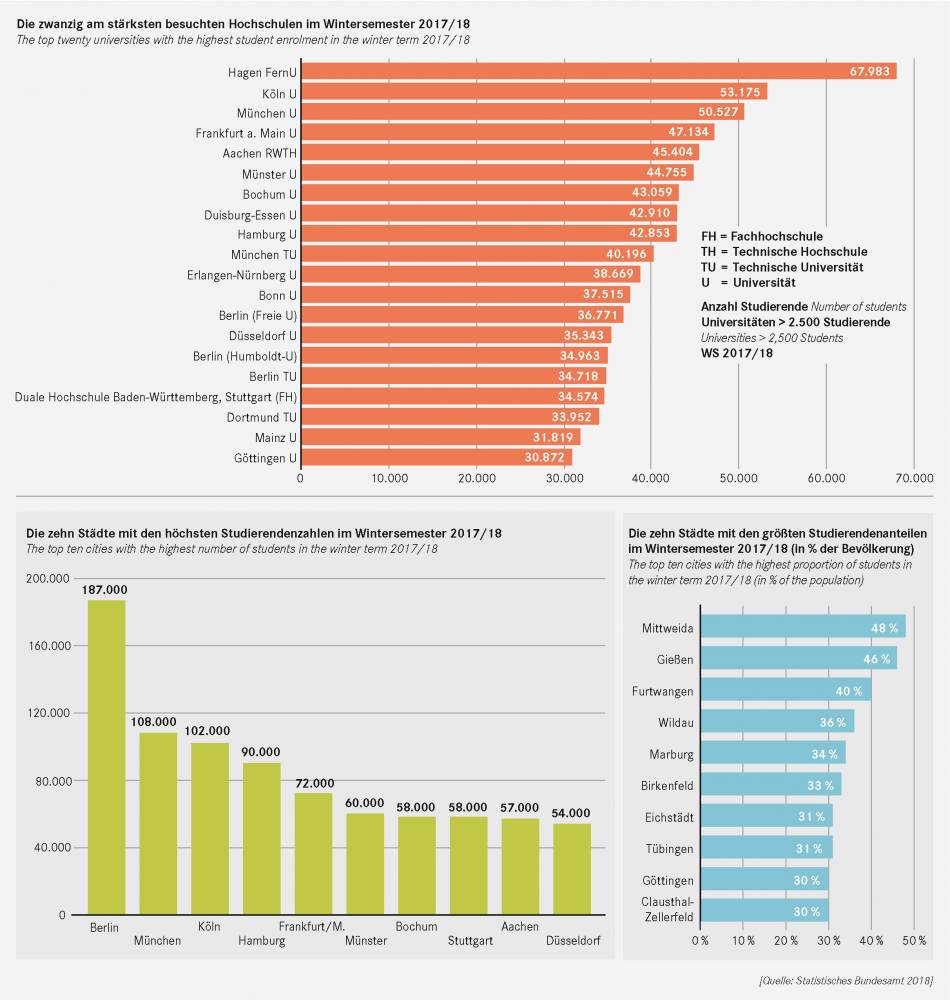
German universities vary considerably in size. About 30 % of all students are distributed between only 20 universities. Among these are not only traditional universities: One-third of the universities founded during the 1960s and 1970s in Western Germany have seen their enrolment numbers surpass 20,000 students. Universities meanwhile in East Germany have only in recent years begun to recover from the restrictive admissions policies of the former Communist regime and the migration losses after the fall of the Berlin Wall. Despite the vast numbers of students concentrated in Germany’s major cities, the real “university towns” are the smaller ones, where one in three or four inhabitants is a student.
8. Founding dates of the largest German higher education institutions
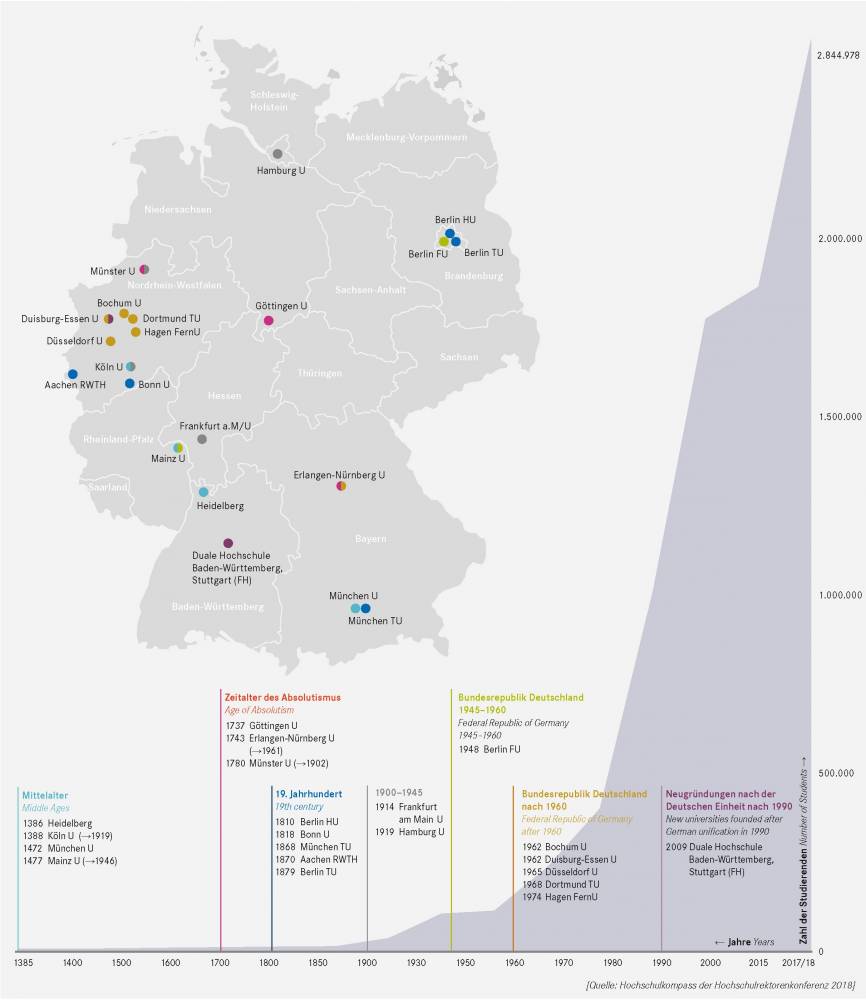
The graph above depicts a selection of German universities founded since the Middle Ages, that started in Heidelberg. Over the centuries, the number of newly founded universities grew very gradually until after World War II when Germany witnessed a rapid increase in new institutions and students.
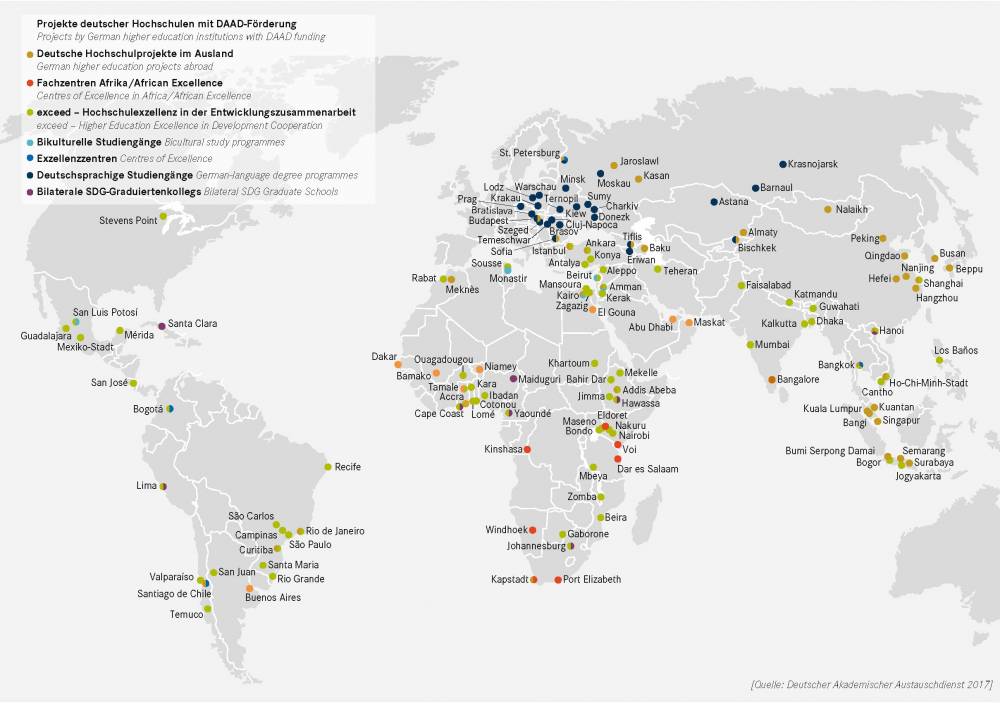
9. German higher education institutions and degree courses abroad
Since the 1990s German universities and universities of applied science, mostly with the help of DAAD funding and expertise, have been “exporting” degree programmes, centres, and faculties to other countries; or they have created such degree programmes, or even entire universities, right there, mostly in collaboration with local partner universities (“transnational education”).
Meanwhile, such institutions exist in 35 countries, providing higher education to some 32,000 students, with numbers expected to rise in the future. The underlying motivation is not to make a profit, even though most of these institutions rely on tuition fees. Usually the aim is to provide educational support in development cooperation, as well as to raise Germany’s visibility and reputation in tomorrow’s “education and research markets.” The largest of these institutions abroad is the German University in Cairo, Egypt.
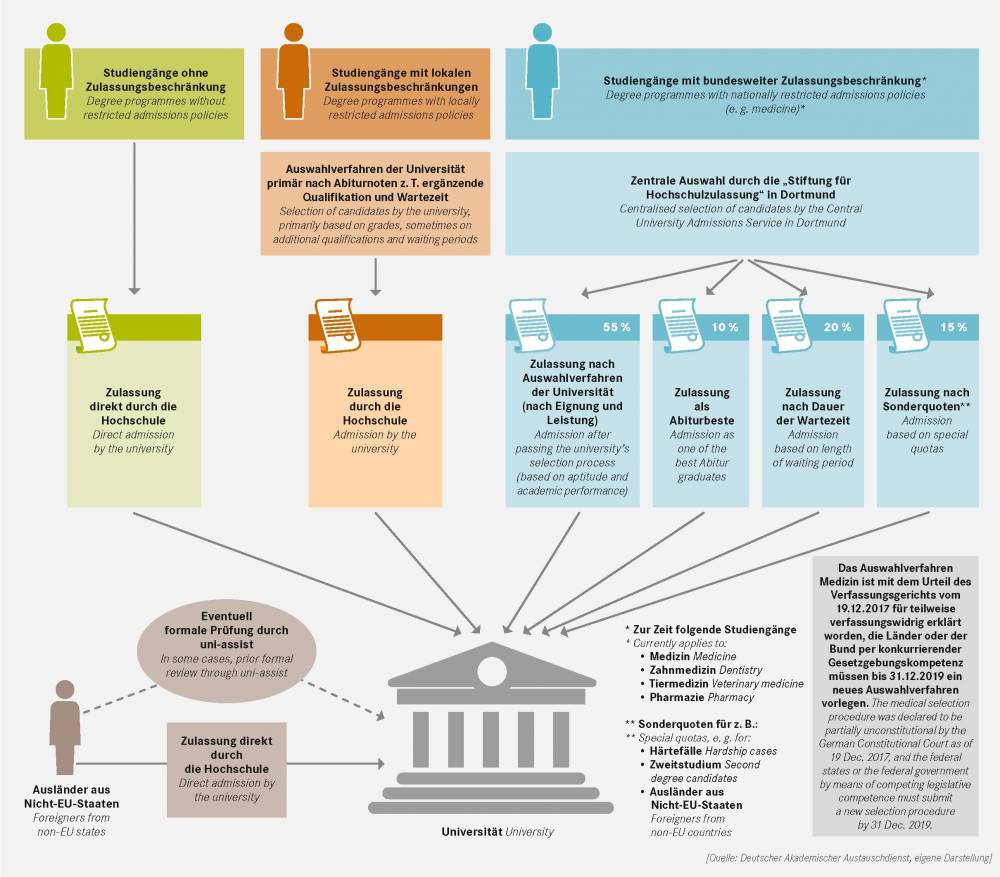
10. Undergraduate admission to German universities
Admission procedures at German universities vary, depending on whether and to what extent the number of available places is limited. There are some degree programmes (in medicine, dentistry, veterinary medicine, pharmacy) that have nationally restricted admissions policies. To be admitted, candidates have to submit their applications to a central admissions service, which either makes admissions decisions of its own (with regard to certain quotas) or admits students based on the various selection procedures in place at the universities. The grades in the school-leaving certificate (Abitur) are the most important criteria for admission. In addition, standardised tests, interviews, or prior completion of a relevant vocational training programme may play a role.
As far as admissions regulations are concerned, applicants from EU states are treated on the same basis as German applicants. International students from non-EU states always apply directly to the universities, many of which use the University Application Service for International Students (uni-assist), to review applicants’ formal eligibility.
German universities currently offer (2017/18) 19,011 degree programmes; 8,667 lead to a bachelor’s degree, 55.2 % of them with open admissions, and 8,703 to a master’s degree. The percentage with open admissions is as high as 64.6 %.
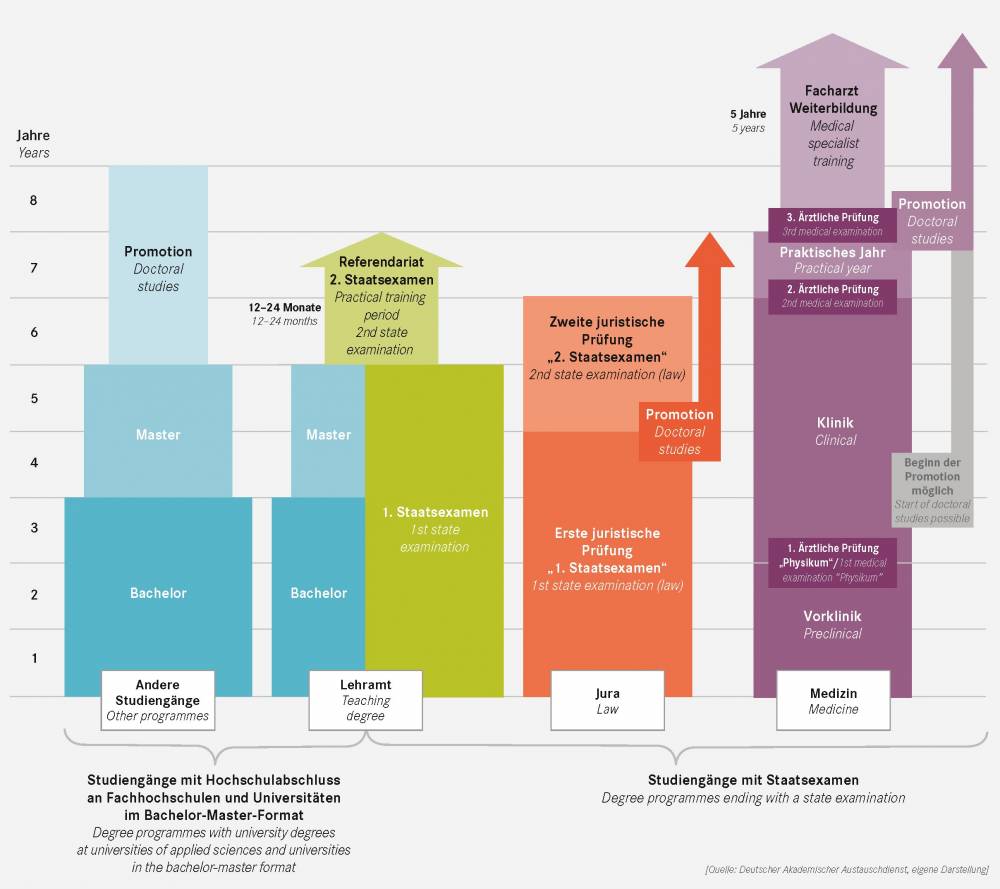
11. The structure of university study
The university degree, which is completed with a university examination, has now been converted to the Bologna system. The entire study cycle is designed for eight years, consisting of three years of undergraduate studies, a two-year master's programme and three further years of doctoral studies.
Some degree programmes such as human, dental and veterinary medicine, pharmacy and law continue to end with state examinations. Teacher training programmes are currently organised differently in different countries, some in the Bologna system, while others still require candidates to pass state examinations. For lawyers and teachers who wish to enter civil service, the programmes are followed by a state-mandated practical training phase (“traineeship”).
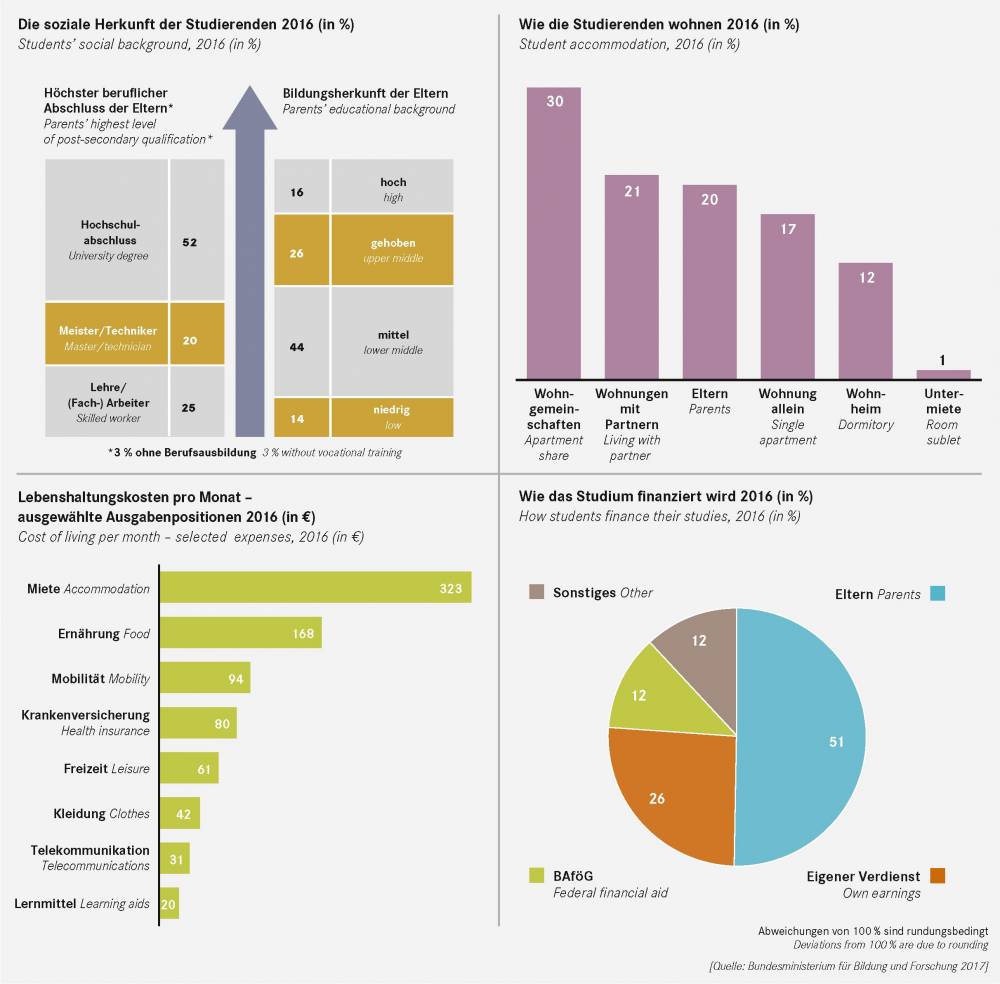
12. The social dimension of university study
According to the 21st survey on the social conditions of German students conducted by the German Student Services (DSW), a considerable proportion of students come from upper-middle class or upper-class homes. Half of all students have parents with university degrees. Regarding accommodation, the apartment sharing or living together with parents or the partner predominates, residence hall accommodation is in short supply. The costs of study average € 819 per month (not including tuition fees). Statistical averages for the entire student population show that roughly 50 % of these costs are covered by students’ parents. Another 25 % are covered by the students themselves.
Government financial aid (BAföG) is of minor importance in this context.
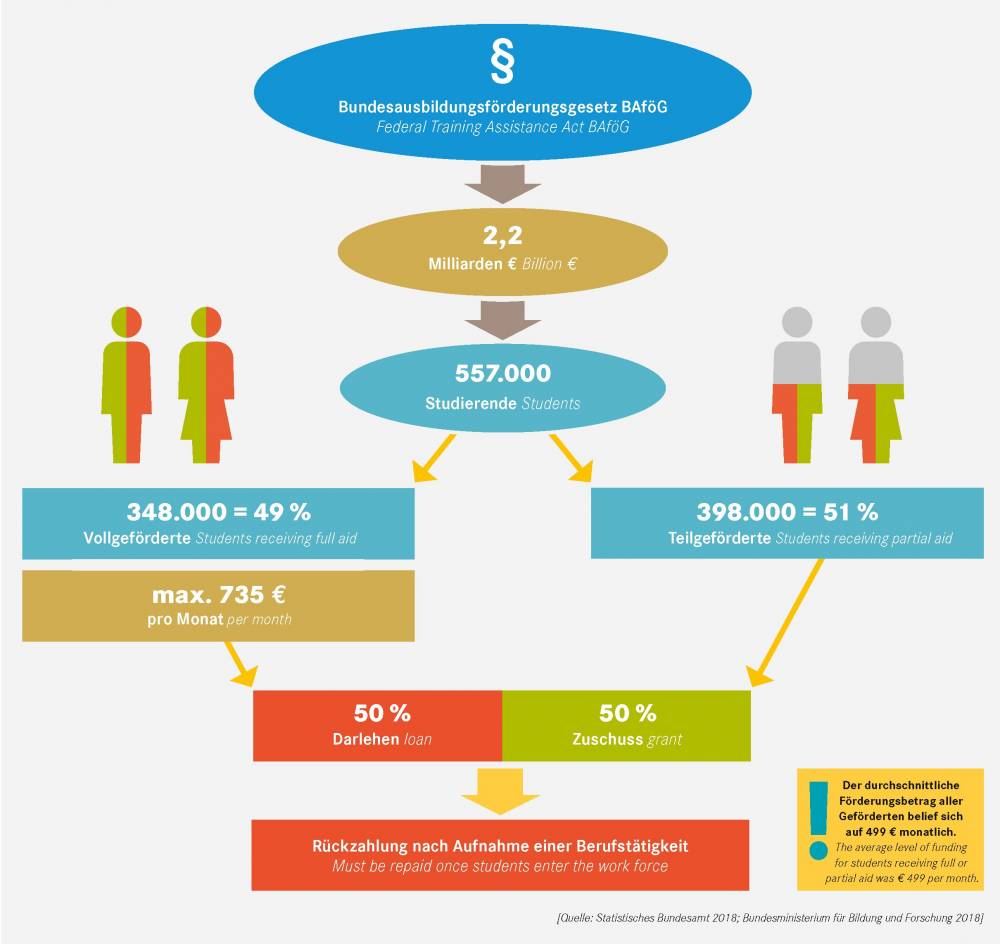
13. Government financial aid for students 2017/18 (BAföG)
Federal and state financial aid for students (secondary school and university) is designed to subsidise the costs of living, including those who are studying abroad based on parental income. The maximum amount of aid − which may add up to € 735 per month, depending on the type of institution students attend (e. g. Gymnasium or university) and the type of accommodation (e. g. living with their parents or away from home) − was awarded to 49 % of all funded university students. The rest received partial financial aid. The average level of funding was € 499 per month. Since the 25th Amending Act to the Federal Training Assistance Act 2015, the federal government has fully financed BAföG; the federal states are no longer involved in the financing.
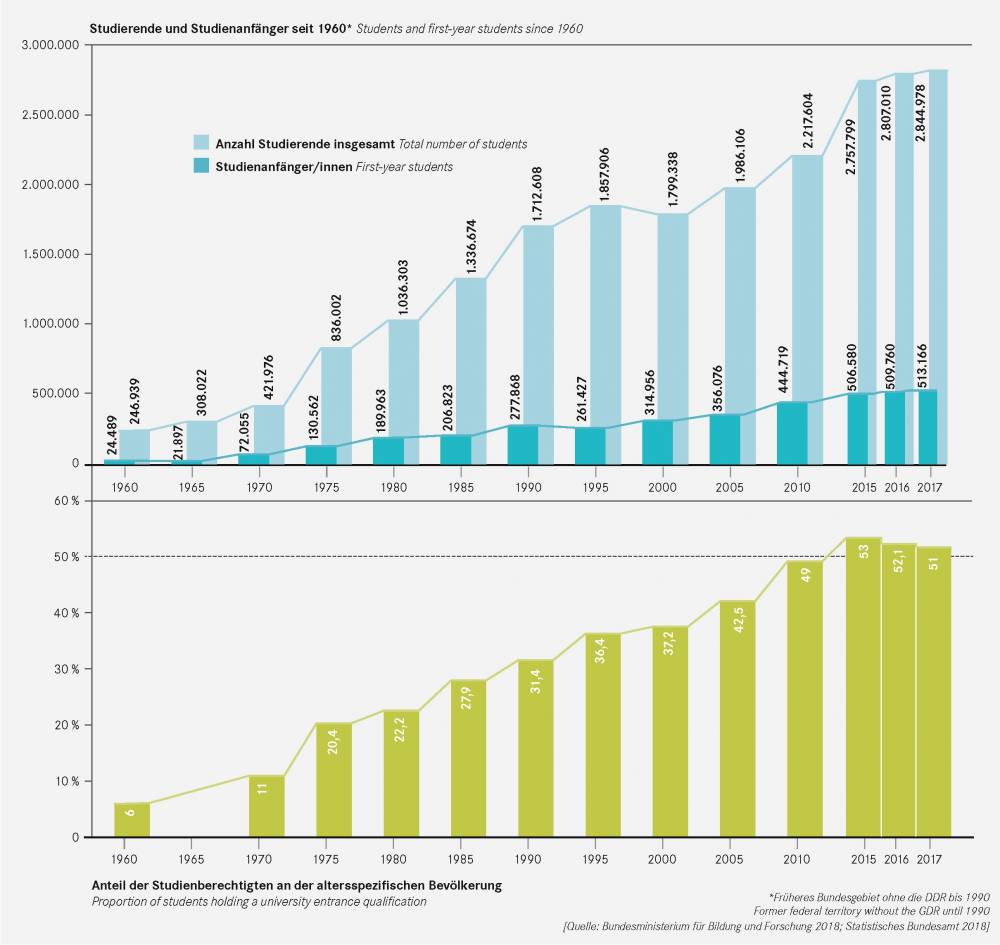
14. The increase in the student enrolment since 1960
Higher education expansion in Germany started later than in comparable countries, but gained a remarkable momentum since 1960 that continues to this day. This was largely due to a diversification of ways to earn a university entrance qualification, the emancipation of women and the evolution of universities of applied sciences as alternatives to traditional universities.
The diagram shows student enrolment in higher education, not just at universities, at which almost two-thirds of all students are enrolled. Of the graduates of general secondary and vocational schools, more than half were entitled to study in 2017. For many years, 25 to 30 % of those eligible for university admission chose not to enrol in higher education but rather pursue a vocational training degree in Germany’s highly developed “dual” vocational training system, which combines classroom learning with on-the-job training.
As a result of the new trend to combine vocational training and university study, Germany’s higher education institutions are seeing record enrolment in spite of declining age cohorts.
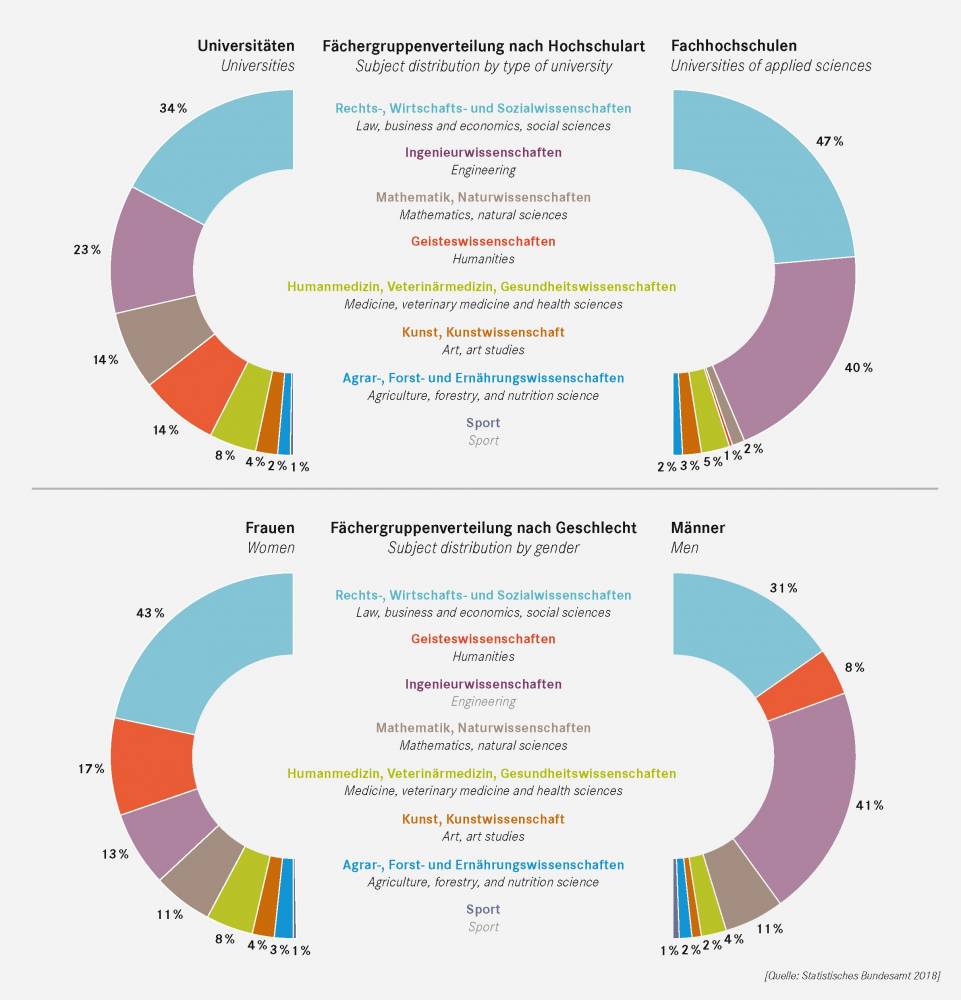
15. Who studies what? The distribution of subject groups in the winter term 2017/18
A look at the distribution of students by field of study, as shown above, reveals the strong differences in the course offerings at universities and universities of applied sciences. Whereas university students are predominantly enrolled in the humanities, students at universities of applied sciences mostly study engineering. Business administration and economics, law and social sciences attract the most students at both universities. If one considers the genderspecific distribution of university students, engineering and science emerge as male-dominated fields of study, whereas women far outnumber men in languages, humanities and cultural studies. More or less balanced proportions of male and female students are now the norm in law, business administration/economics, social sciences and medicine, as well as the natural sciences.
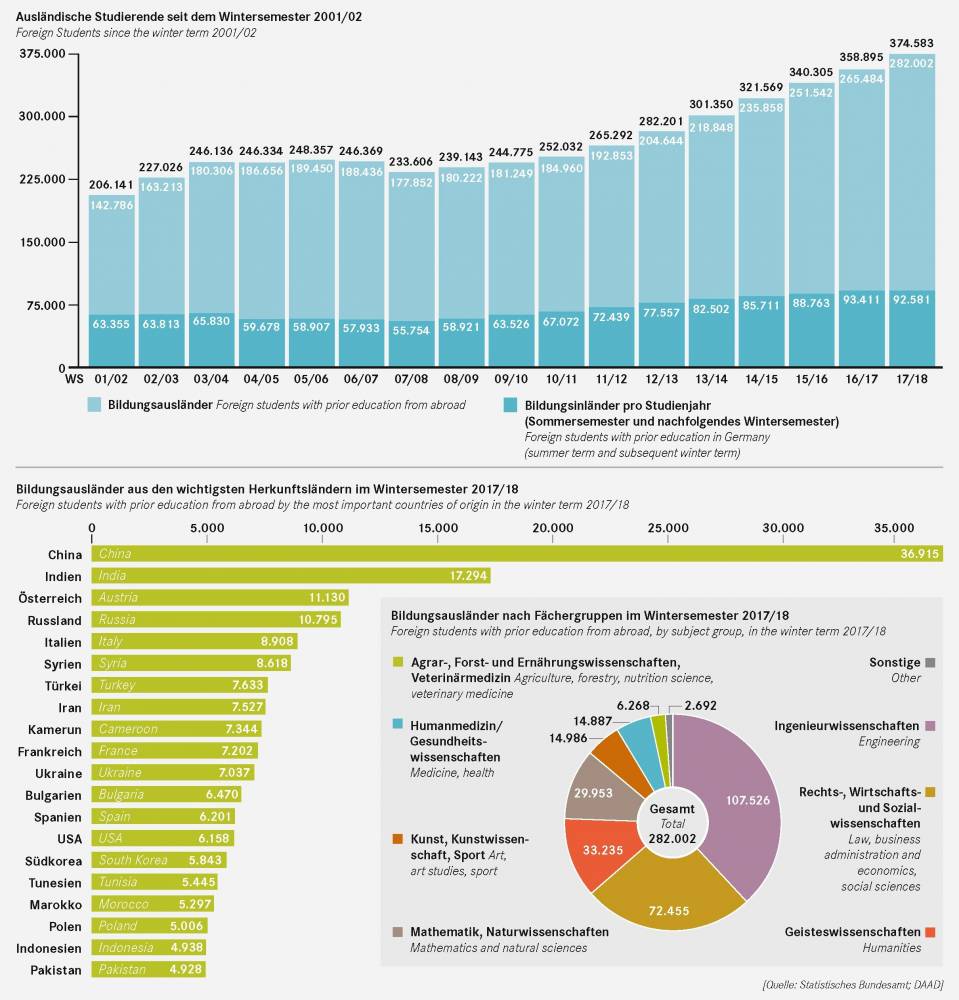
16. Foreign students enrolled at German universities and universities of applied sciences
As a result of global university expansion and increased marketing efforts, the number of international students enrolled at German universities has grown substantially, especially over the past 20 years. Today Germany is one of the five most important countries hosting international students. Of the international students studying in Germany, more than one in four are so-called “Bildungsinländer”, i.e. resident foreigners holding a university entrance qualification acquired in Germany. Over 75 % of foreign students are “Bildungsausländer”, i.e. foreign students who have obtained a secondary school education from abroad. In the winter term 2017/18, the majority of "Bildungsausländer" came from China.
17. German students studying abroad
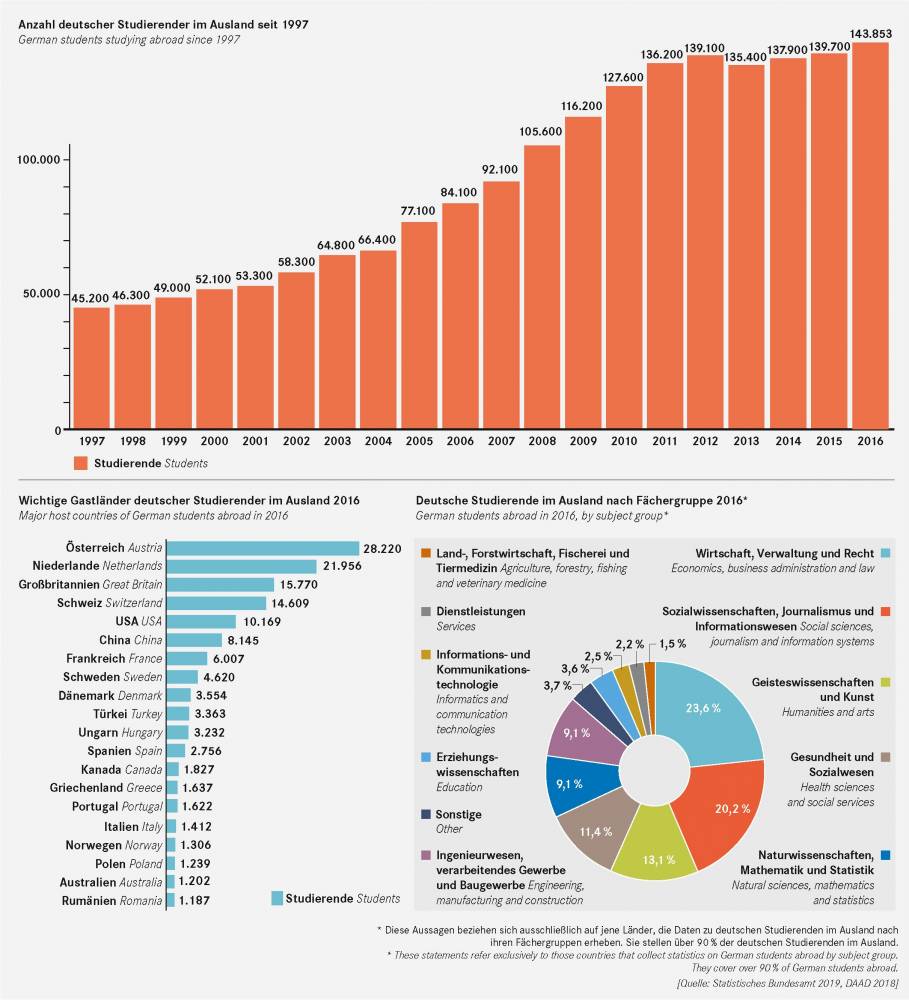
The number of German students who complete a semester or even an entire degree programme abroad has seen a significant increase during the past ten years. The most popular destinations for German students are neighbouring European countries, particularly Austria and the Netherlands. A relatively high number of students choose to study law, social sciences, business administration and economics abroad.
18. Erasmus+ Countries of origin and host countries of German and foreign students
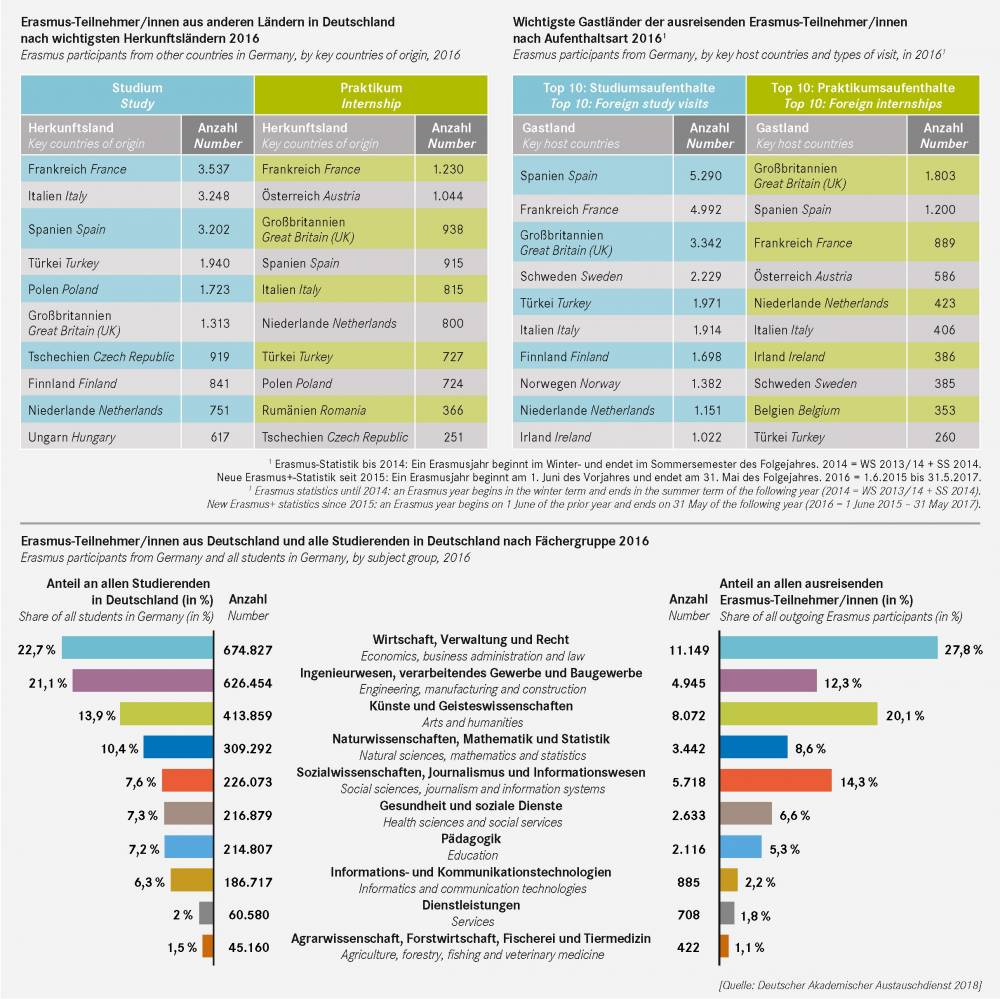
The three most popular Erasmus host countries among students of German universities are Spain, France and the United Kingdom. Spain and France are the top study destinations, while the UK is by far the most popular destination for Erasmus internships.
Especially students from France, Italy and Spain choose to participate in Erasmus study visits in Germany. French, Austrian and British students comprise the majority of students who complete an Eramus+ internship in Germany.
With respect to the most popular subject groups among Erasmus+ participants, the subject group economics, administrative and legal sciences comprises the largest share with almost 30 %. This is followed by the arts and humanities, social sciences, journalism and information systems, all of which are popular among outgoing Erasmus students.
19. Doctoral study
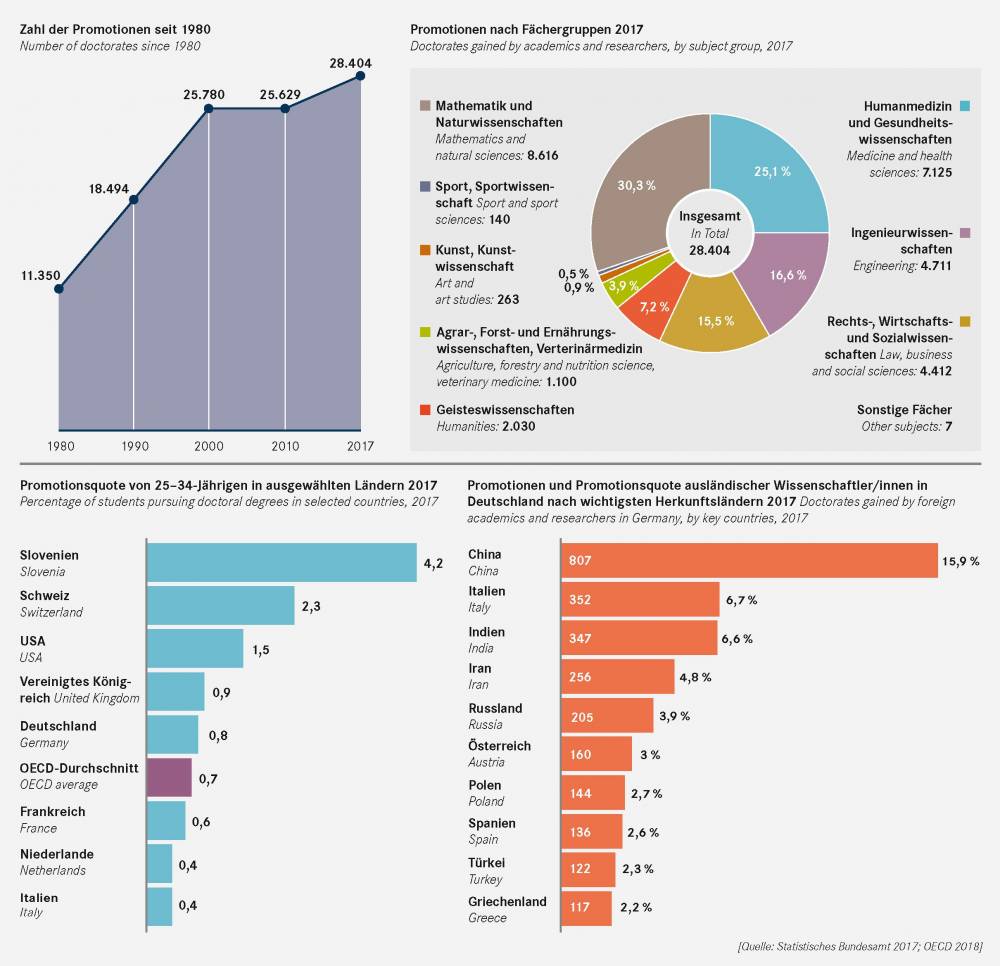
The percentage of students graduating from German universities with a doctoral degree is slightly above the international average. In the natural sciences, e.g. in chemistry, over 30 % of graduate students earn their doctorate, followed by the medical profession, of which a quarter earn their doctorate. The average age of doctoral students at graduation has decreased in recent years. Until recently, doctoral candidates did not have a clearly defined enrolment status and mostly followed the traditional path of independent, individualised study under the supervision of a so-called “Doktorvater.” This is now changing as part of the Bologna Process. Key elements in these reforms include creating structured doctoral training programmes, shortening the doctoral period to an average of three years, giving doctoral candidates a clearly defined enrolment status, and establishing graduate schools and research training groups.
20. Habilitation − The route to becoming a university professor
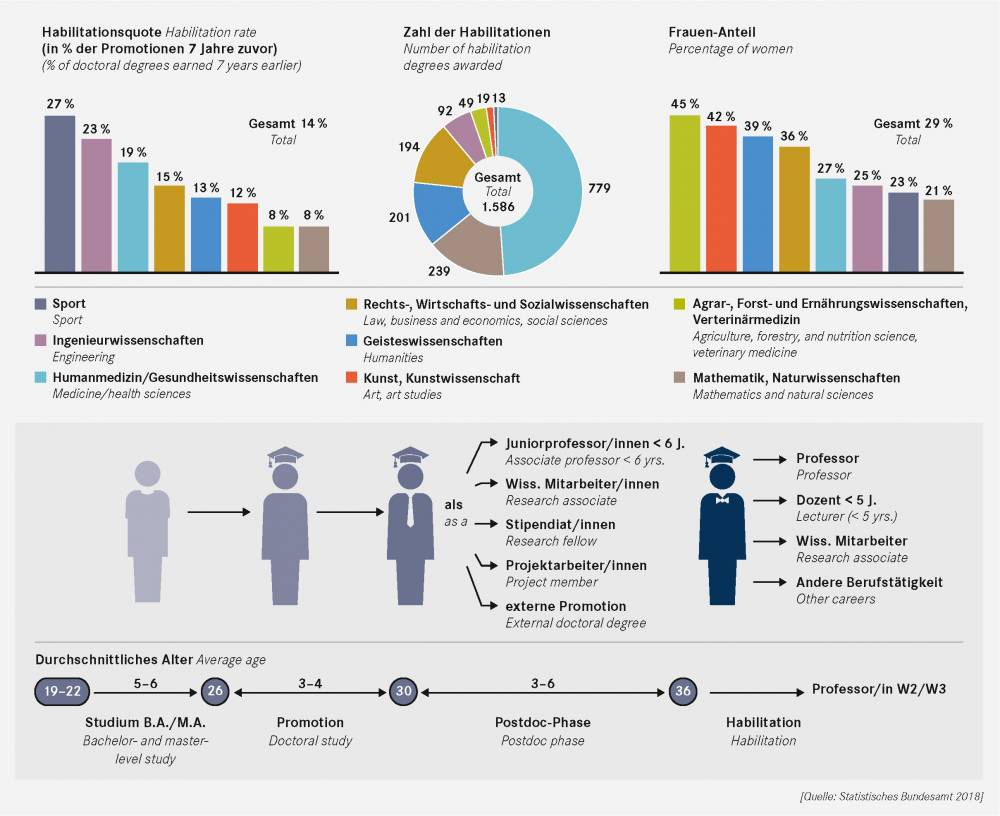
The habilitation degree is a special feature of the German higher education system. It is the standard requirement for being appointed as a university professor (except in engineering, where a doctoral degree and an outstanding record of professional achievement are the rule. The same applies to all subjects at universities of applied sciences). Habilitation rates vary widely by subject, however. While the standard time for earning the habilitation should not exceed six years, researchers often take much longer to do so.
In recent years, the “associate professorship” (lasting up to six years) has been created as an alternative route to becoming a full professor; there are still not many of these positions, however, and most of them are non-tenure track (lifetime appointment after a limited probation period). The habilitation scheme has long been publicly criticised as candidates already demonstrate their ability to complete independent research by earning their doctoral degree; the habilitation simply delays entry into a highly qualified career. It may be substituted with habilitation-like research accomplishments (e.g. a set of highly visible publications, awards and scholarships).
21. Staff at higher education institutions
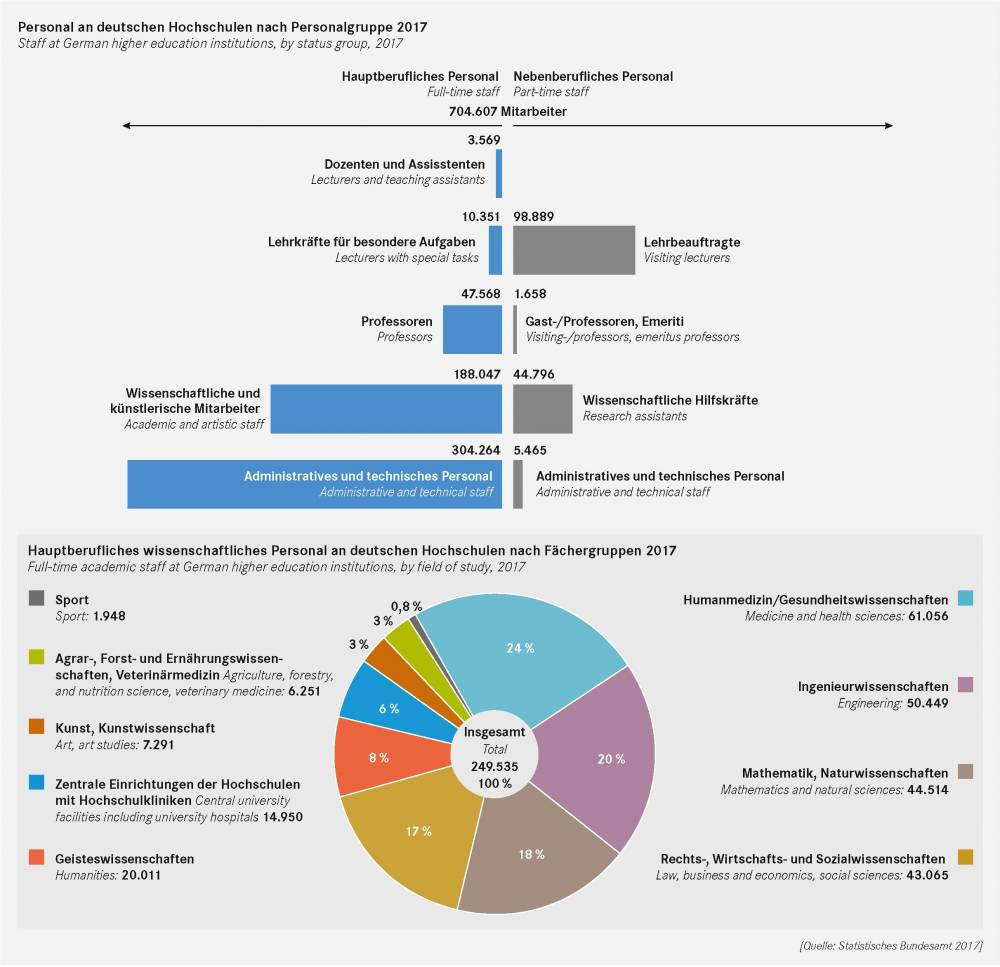
In 2017, German universities employed a total of 249,535 full-time academic staff: of these, 47,568 were professors. These were supplemented by 145,343 part-time professors, visiting lecturers and research assistants.
A total of 304,264 non-academic staff members provided administrative, technical and caretaking services. The largest portion (32 %) of this group was employed in the field of administration. The majority of academic staff are employed in the medical field, followed by engineering (20 %), natural sciences (18 %), and law, economics and social sciences (17 %). The vast majority of academic staff has fixed-term contracts and is affiliated with one of the professors. Fixed-term employment, the lack of independence and uncertain career prospects − given the scarcity of professorial positions − have been the subject of controversial discussion for a long time.
22. Proportion of women at German higher education institutions
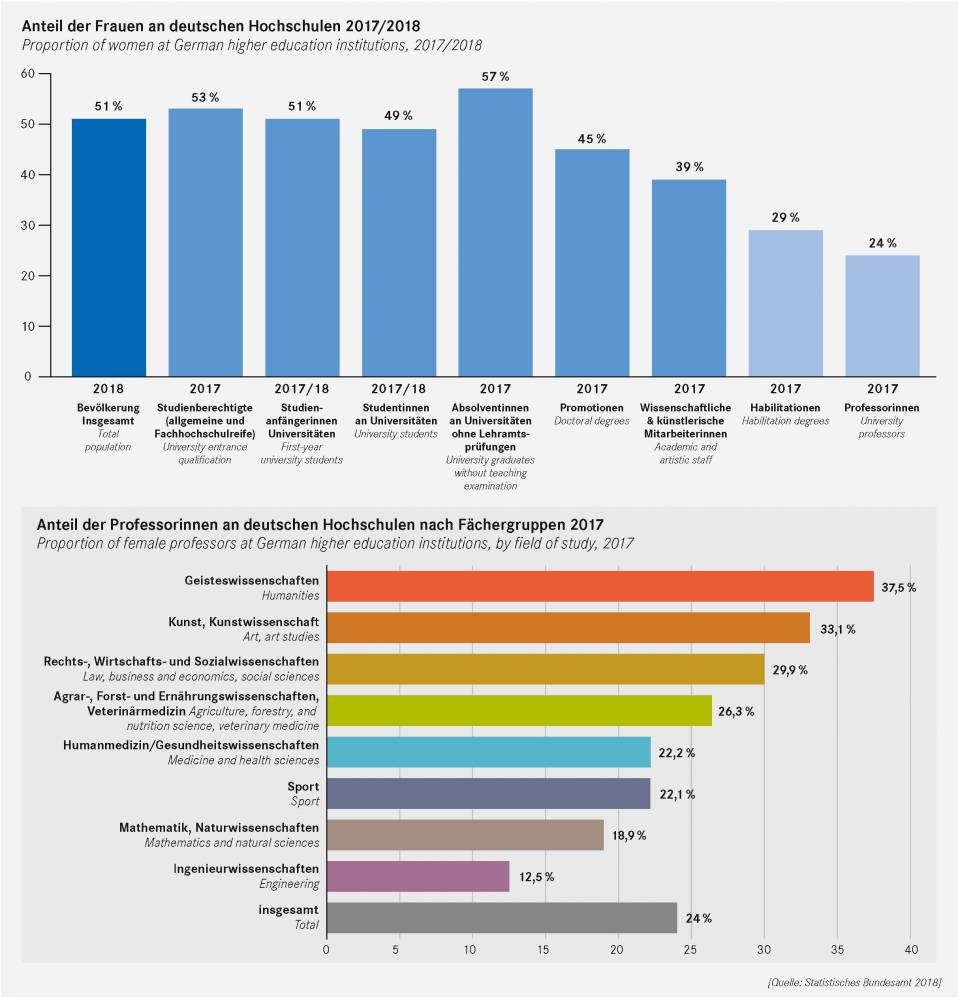
Although women are overrepresented among German school leavers, firstyear university students, and university graduates, their share among those holding advanced degrees continues to be much smaller. This is especially true of the habilitation degree, and thus of women’s chances of being appointed as professors positions which still largely depend on the habilitation degree. In recent years, however, the situation has improved as a result of systematic efforts to promote female scholars. Moreover, the representation of women in academia varies by subject: whereas their share is higher in teacher training programmes, for example, they constitute only a minority in engineering programmes.
23. Foreign academic staff in Germany
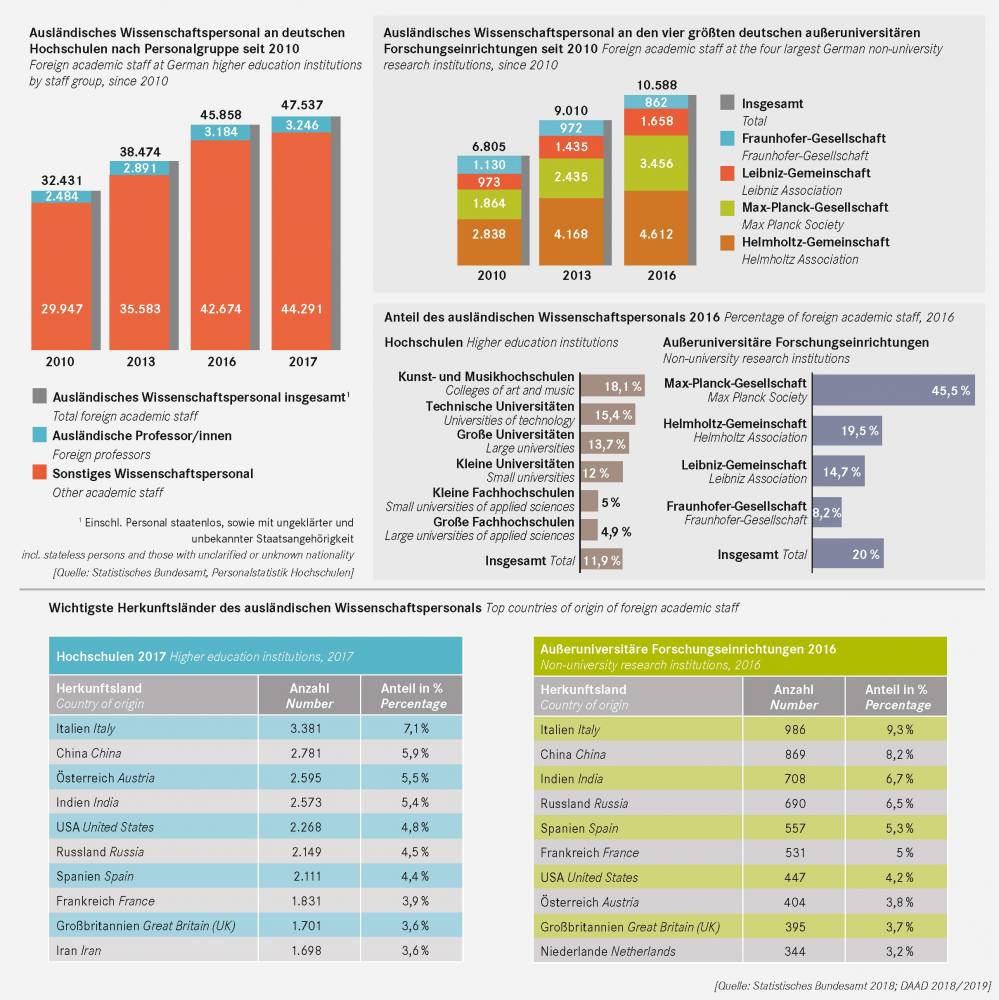
In 2016 more than 56,000 academic staff with foreign citizenship were employed under contract at German higher education institutions and nonuniversity research institutions. This number has increased by about 44 % since 2010. Four out of five foreign academics are employed at universities, while the remaining fifth work at the Germany’s four largest non-university research institutions. These academics constitute a higher share of total staff employed at the research institutions (about 20 %) than at universities (about 12 %). This percentage varies greatly depending on the type and size of the higher education institution. The same applies to the four largest non-university research institutions.
Italy, China, India, Russia and the United States are the most common countries of origin among foreign academics. The differences between higher education institutions and non-university research institutions are negligible.
24. Exchange of visiting researchers between Germany and other countries
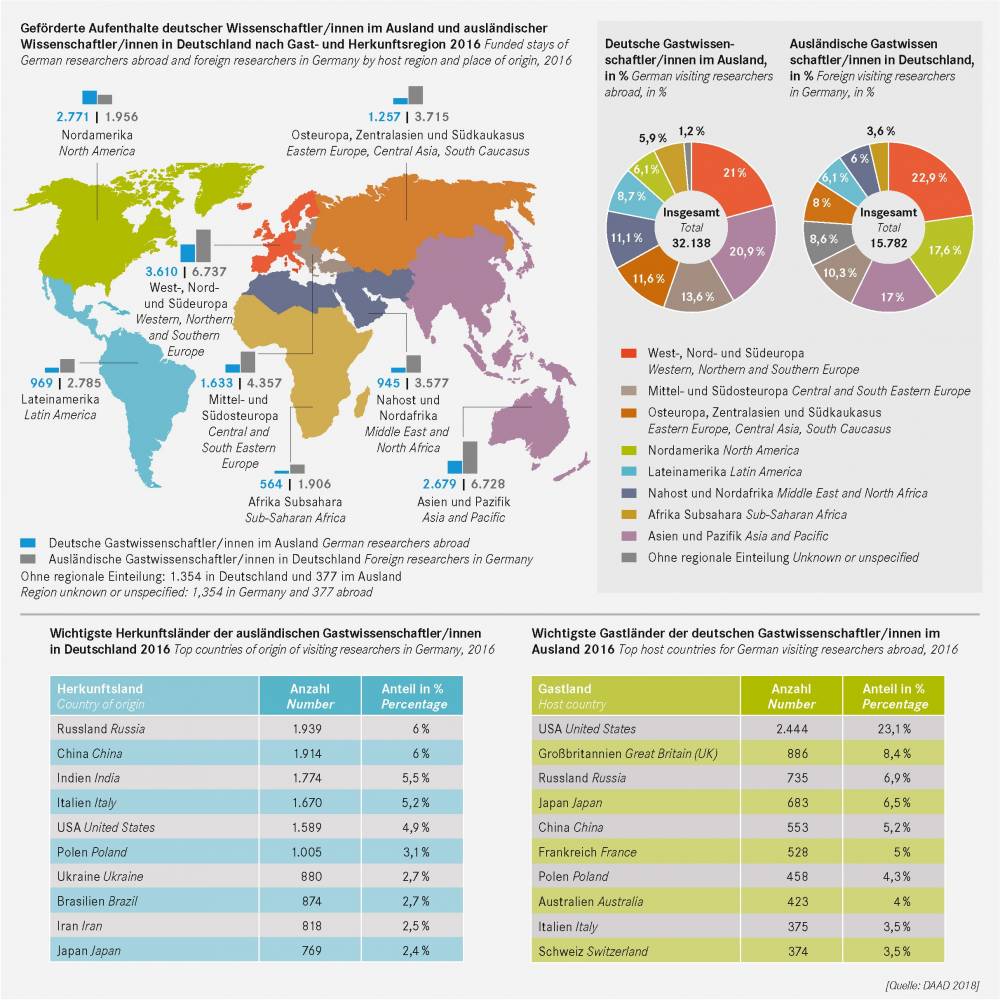
In 2016 some 32,000 foreign researchers completed research visits in Germany with financing from German and foreign organisations. In that same year, approximately 16,000 German researchers received funding for research visits abroad. The term “visiting researcher” describes persons who visit Germany on a temporary basis with funding and are involved in teaching and research activities at higher education institutions or research organisations in a nonemployed status.
The top three countries of origin of foreign visiting researchers are Russia, China and India. The trend shows an increasing number of visiting researchers from Western, Northern and Southern Europe, as well as Asia and Pacific.
The United States is the most important host country for German visiting researchers. The top positions among host regions are held by Western, Northern and Southern Europe, North America and Asia and Pacific.
25. The government and universities – Responsibilities, governance and cooperation
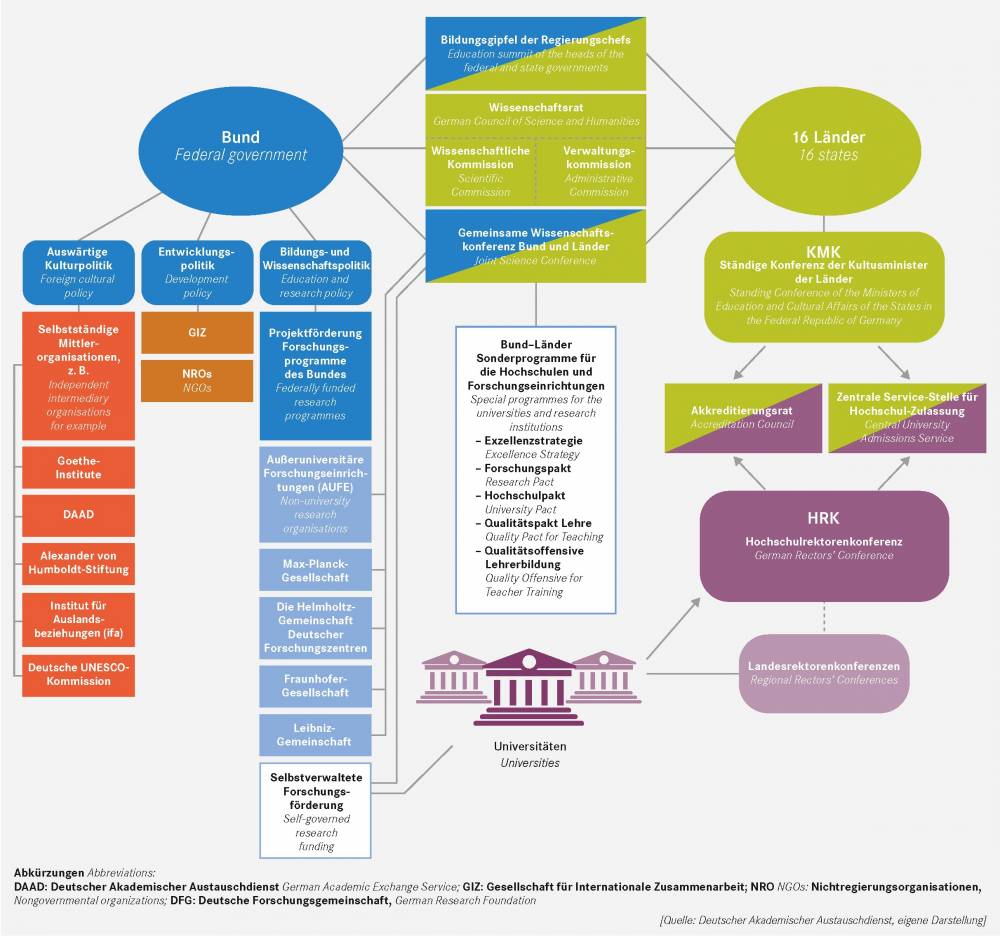
The German system of university funding and governance is characterised by the principle of federalism which gives primary responsibility for education and research to the states, and by the principle of self-governance which gives universities and research organisations a voice in governance and funding issues at the national level as well. This complex system requires wide-ranging coordination, some of which is performed by organisations specifically created for this purpose (German Council of Science and Humanities, Joint Science Conference), mutually representing each other in the relevant institutions and committees. Since the most recent reform of German federalism (2006), the federal government’s role with regard to education has been limited to foreign cultural policy, development policy, research funding, vocational training funding, and special programmes sponsored jointly with the state governments. A recent constitutional amendment enables the federal government to contribute a larger share to education funding, especially with regard to the universities.
26. The dual funding of university-based research
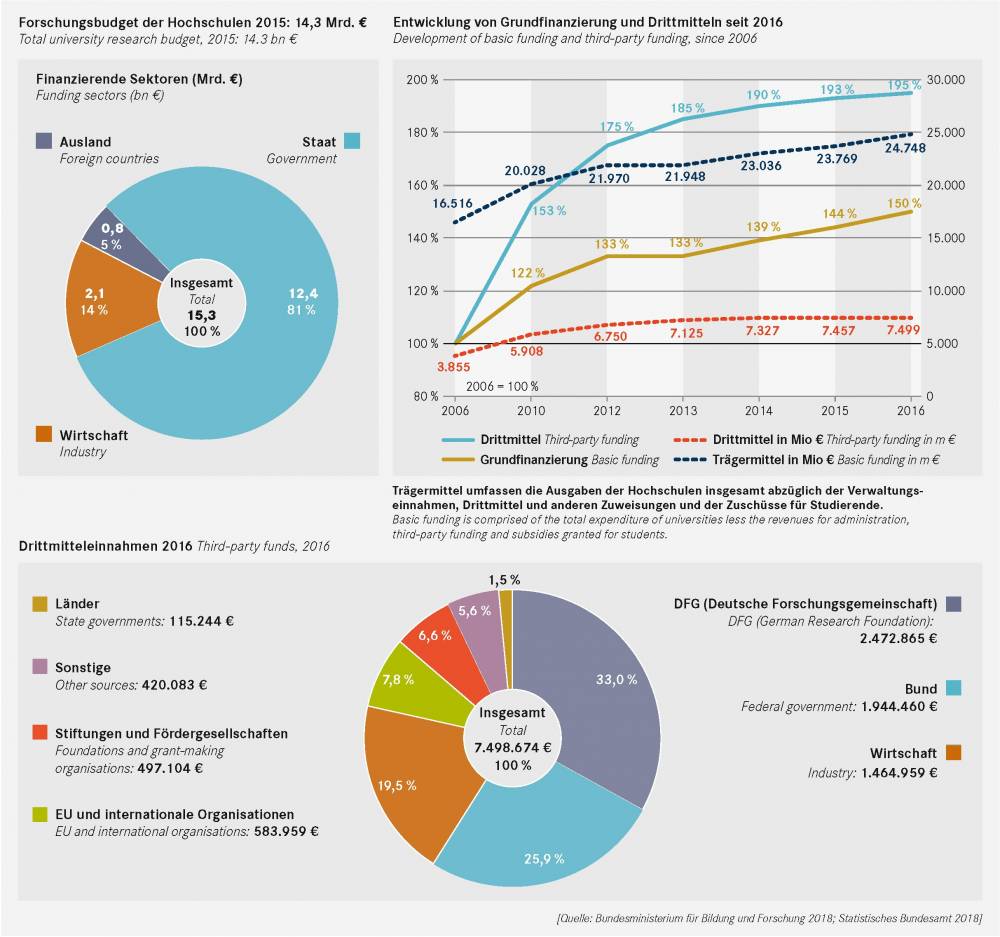
In Germany, research at universities is funded “dual”. The basic financing for staff, laboratories, libraries etc., amounting to 25 bn euros in 2016, is provided by the 16 states as the owners and operators of the universities.
Research projects are largely financed with the help of so-called third-party funds, which are awarded through a process of competitive bidding. The German Research Foundation (DFG), the federal government’s project funding schemes and increasingly those of the European Union as well are the most important funding sources in this regard. Businesses and foundations account for about 26 % of third-party funding. Even though the research funding mix varies widely by university and field of study, there is a general trend towards more third-party funding than basic funding. For university-based research there are not enough budgetary resources to sufficiently finance newly formed research projects. Since 2007, DFG-funded projects have received so-called “programme overhead funding” to cover additional costs incurred by the universities. This amounts to a flat-rate of 22 % for projects approved after 2016.
27. The German research landscape and how it is funded
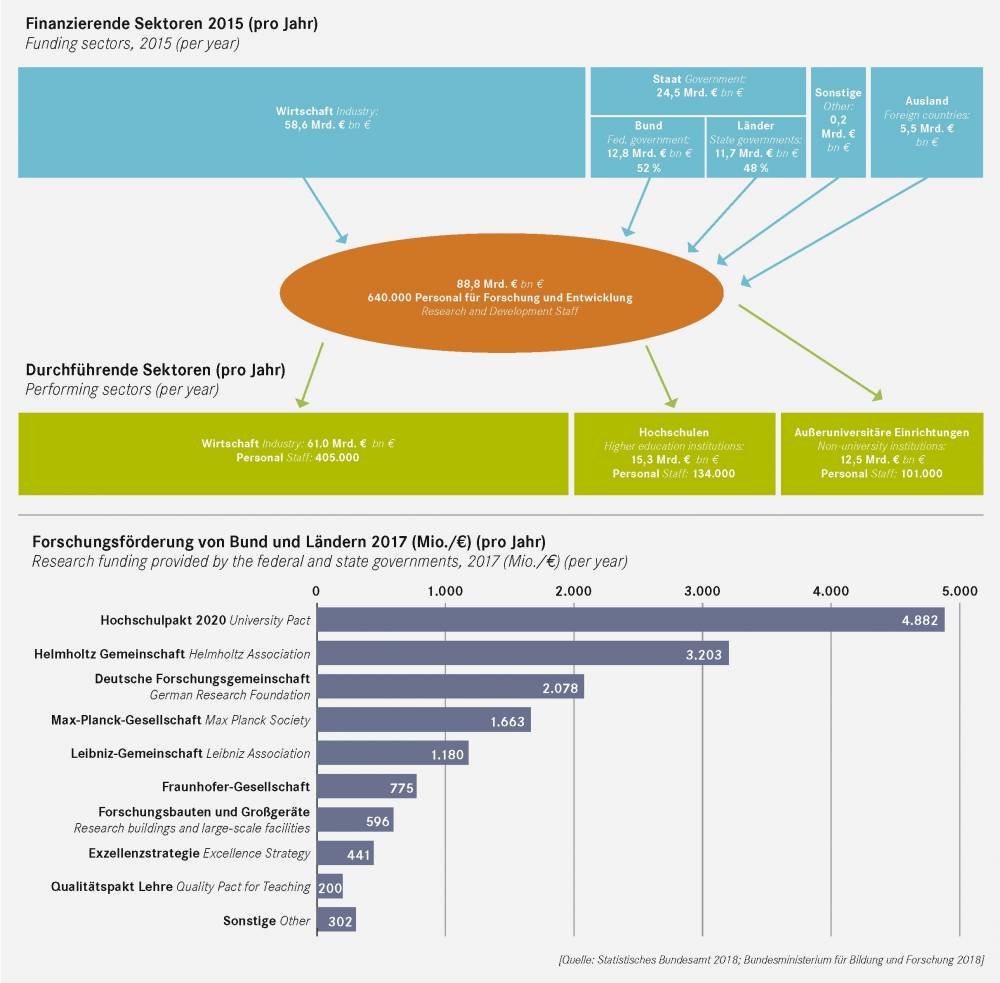
The German national research budget of € 88.8 billion − roughly the equivalent of 2.9 % of the 2015 gross domestic product − is funded by the business community (66 %), the federal and state governments (28 %) and foreign investors (6 %). German companies also play a major role in the implementation of research and technical development. The universities’ research capacities are only slightly larger than those of the state-funded non-university research institutions. The strong position of this non-university sector is primarily the result of the distribution of state and federal powers in the German constitution, which makes it difficult for the federal government to gain direct access to the universities. That is why intensifying the collaboration between universities and non-university research institutions − including the possibility of mergers − has been a dominant theme in current research and higher education policy. Constitutional amendments in Article 91 b facilitate a joint funding of higher education institutions by federal and state governments.
28. The Excellence Strategy
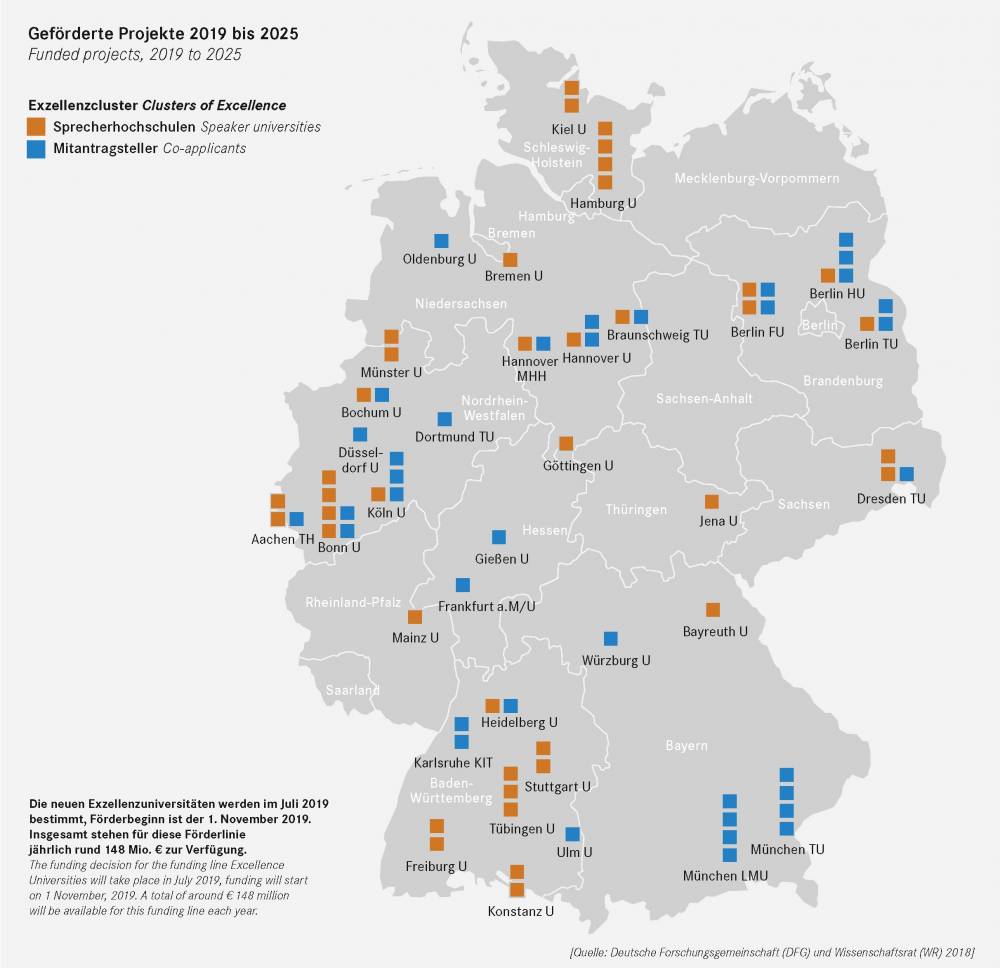
In order to sustainably strengthen Germany as a location for science and make it even more competitive internationally, the German Research Foundation (DFG) and the Science Council (WR) decided in 2016 to continue the Excellence Strategy of the federal and state governments in two funding lines. These are divided into the clusters of excellence and the excellence universities. Each year, two lines of funding totalling 533 million euros are available. 75 % is borne by the federal government and 25 % by the state of the respective university. In September 2018, 57 clusters of excellence from 34 universities were selected by the Excellence Commission. Starting in January 2019, these will receive about three to ten million euros for a period of seven years. In July 2019, the Excellence Commission will select the excellence universities. For this purpose, 17 universities with at least two clusters of excellence and two university clusters with at least three clusters of excellence qualify.
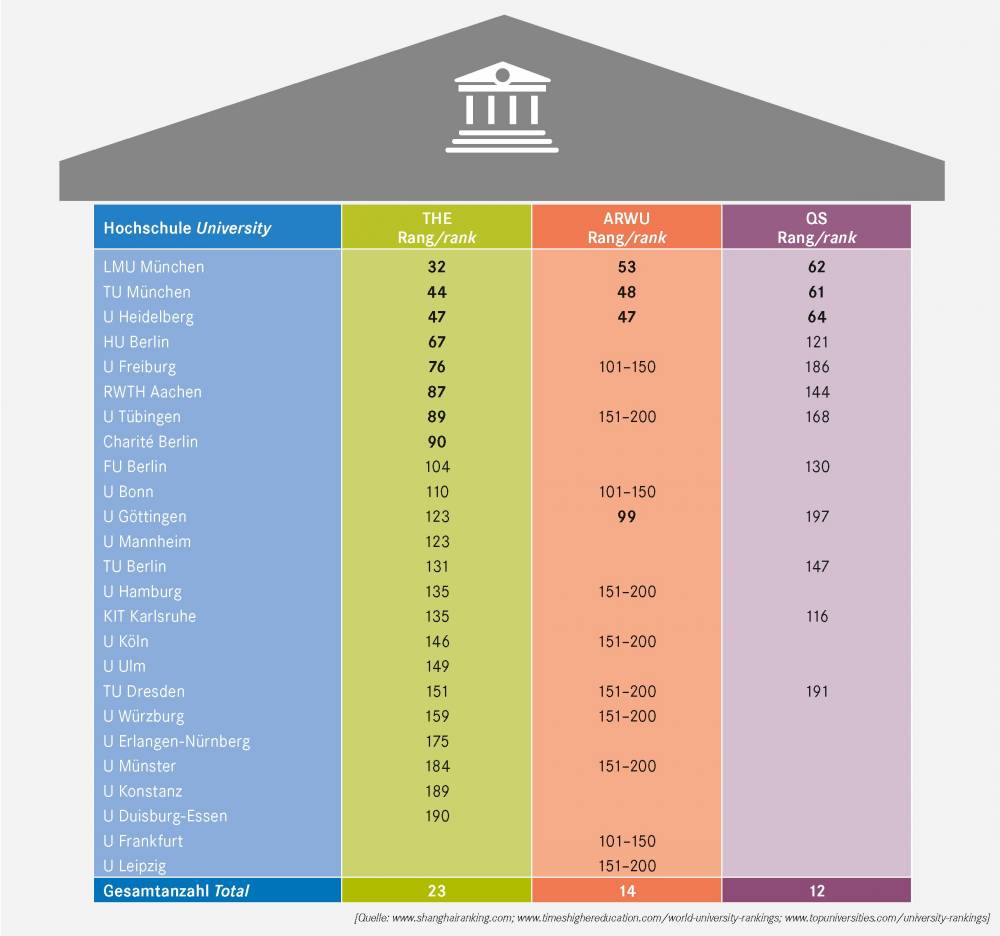
29. The positioning of German universities in the most influential international university rankings (Top 200)
The three most influential international university ranking lists – ARWU (Academic Rankings of World Universities), THE (Times Higher Education World University Rankings), and QS (Quacquarelli Symonds World University Rankings) – are traditionally run by highly prestigious, research-oriented Anglo-American universities, such as Harvard, Stanford, Cambridge, Oxford or the Massachusetts Institute of Technology (MIT). The German universities are comparatively well represented in the rankings and achieve – especially in the THE ranking with nine universities in the top 100 and three placings in the top 50 – a good international visibility.
The heterogeneity of the German higher education sector, however, can not adequately reflect the three global rankings: smaller and specialised universities (such as music and art colleges) or polytechnics are not included in the research-focused rankings.
30. German Rectors’ Conference
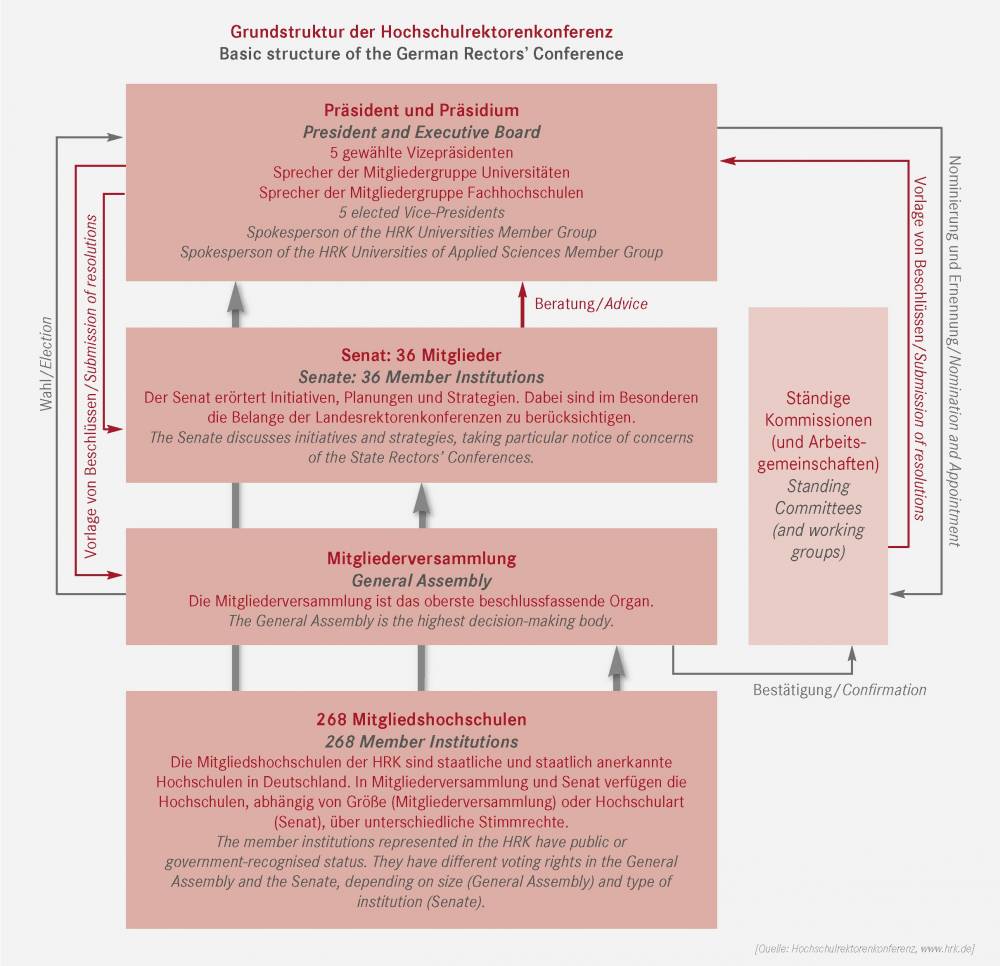
The German Rectors’ Conference (HRK) is the association of public and government-recognised universities in Germany. It functions as the voice of the universities in dialogue with politicians and the public and as the central forum for opinion-forming in the higher education sector. The HRK deals with all issues relating to the role and tasks of higher education institutions in academia and society, especially teaching and studying, research, innovation and transfer, scientific further training, internationalisation, and university self-administration and governance. It has three main tasks: opinion-shaping and political representation, development of principles and standards in the higher education system, and services to higher education institutions and the public.
31. The German Academic Exchange Service
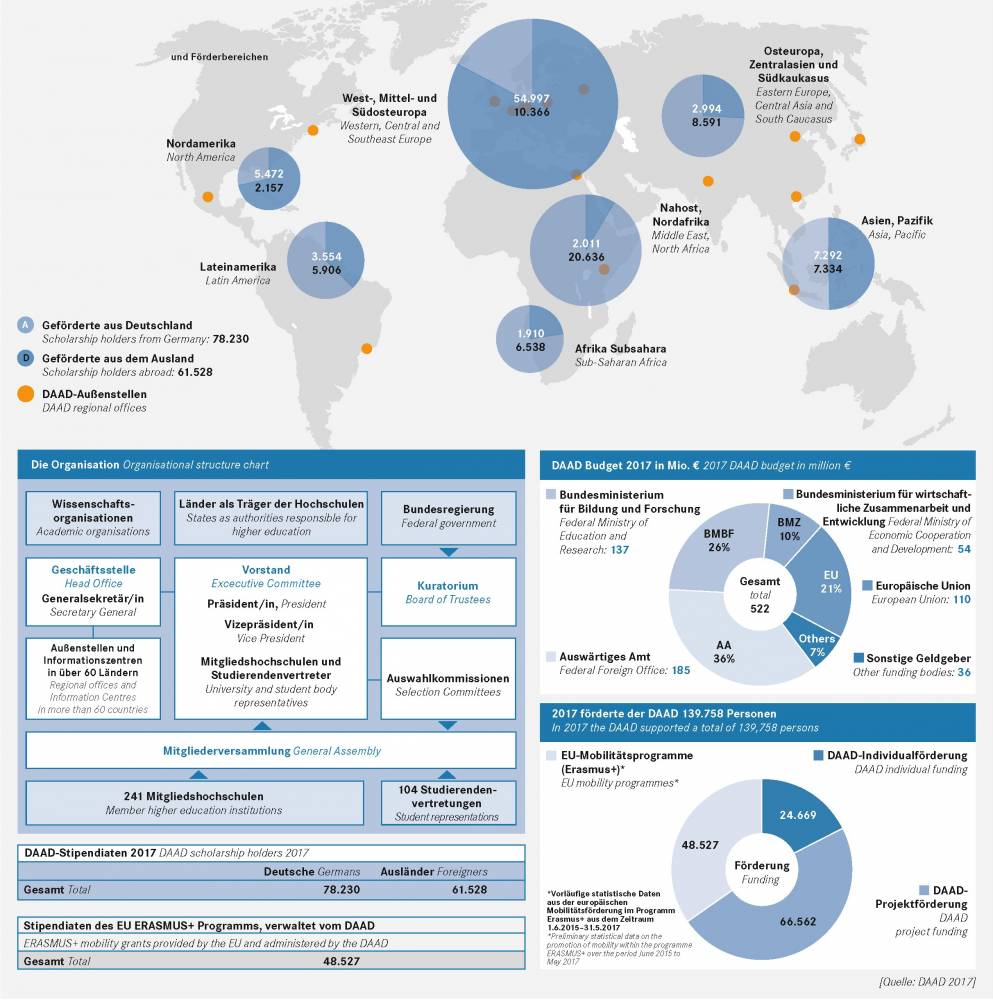
With a budget of € 522 million (2017) − 90 % of which come from public sources − and about 140,000 grants and scholarships, the DAAD is the world’s largest organisation supporting academic exchange and international scientific collaboration. Funding decisions are made independently via the DAAD’s own grant committees. Its funding priorities include awarding scholarships, supporting the internationalisation of German universities, promoting German studies and the German language abroad and assisting developing countries in establishing effective universities. The DAAD has regional offices and Information Centers in over 60 countries. It also serves as the National Agency for the ERASMUS+ programme and the German centre for the global IAESTE programme.
32. The Alexander von Humboldt Foundation
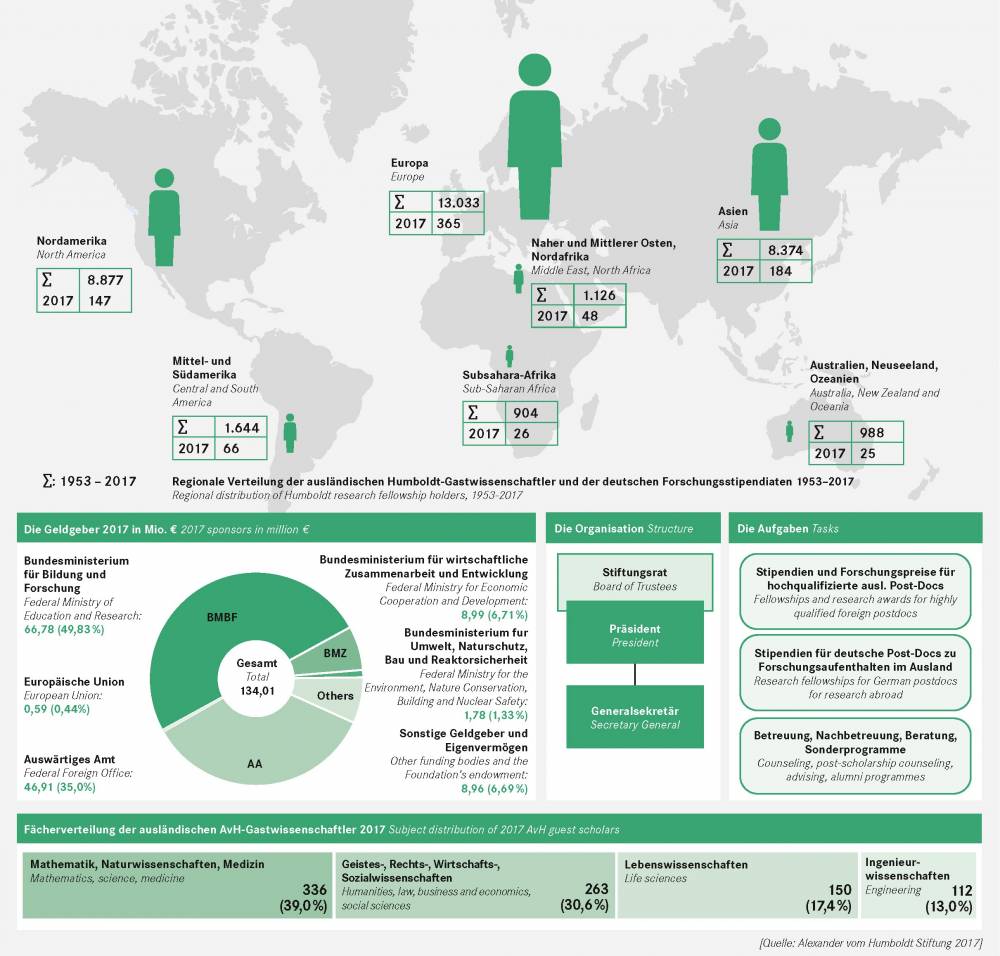
The Alexander von Humboldt Foundation promotes academic cooperation between excellent scientists and scholars from abroad and from Germany.
Its selection committees comprise academics from all fields of specialisation who make independent decisions, based solely on the applicant’s academic record. There are no quotas, neither for individual countries, nor for particular academic disciplines. The Humboldt Foundation supports people, not projects; it grants more than 800 research fellowships and research awards annually. These allow scientists and scholars from all over the world to come to Germany to work on a research project they have chosen themselves together with a host and collaborative partner. Scientists or scholars from Germany can also profit from the support and carry out a research project abroad as a guest of one of well over 29,000 Humboldtians, the Humboldt Foundation alumni. The Foundation maintains a network of academics from all disciplines in more than 140 countries worldwide − including 55 Nobel Prize winners.
33. The Goethe-Institute
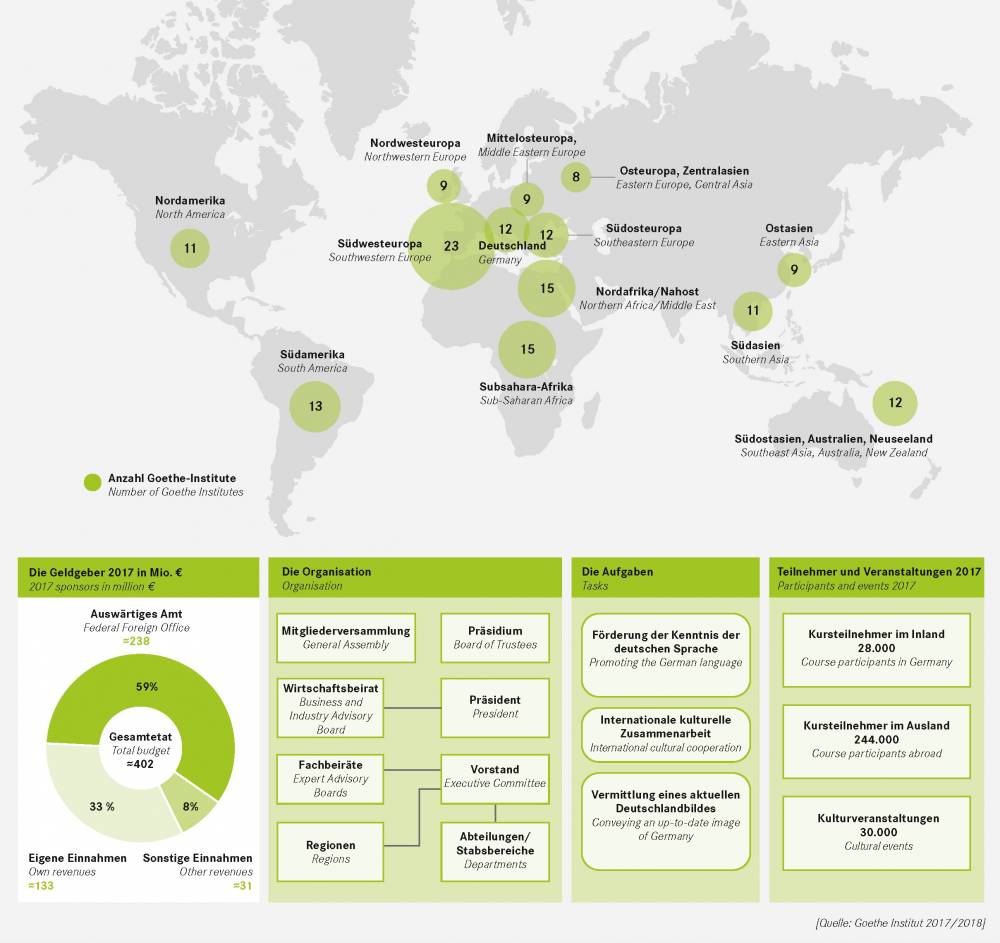
The Goethe-Institute is the Federal Republic of Germany’s cultural institution, operational worldwide. It aims to promote knowledge of the German language abroad and foster international cultural cooperation. The Goethe Institute conveys a comprehensive image of Germany by providing information about cultural, social, and political life in our nation. The cultural and educational programmes encourage intercultural dialogue and enable cultural involvement. They strengthen the development of structures in civil society and foster worldwide mobility. With the network of Goethe Institutes, Goethe Centers, cultural societies, reading rooms, and exam and language learning centres, this institution has been the first point of contact with Germany for over sixty years. Long-lasting partnerships with leading institutions and individuals in around 100 countries create enduring trust in Germany. As an independent and nonpartisan institution, the Goethe Institute is a partner for all those who actively engage with Germany and its culture.
34. The German Research Foundation
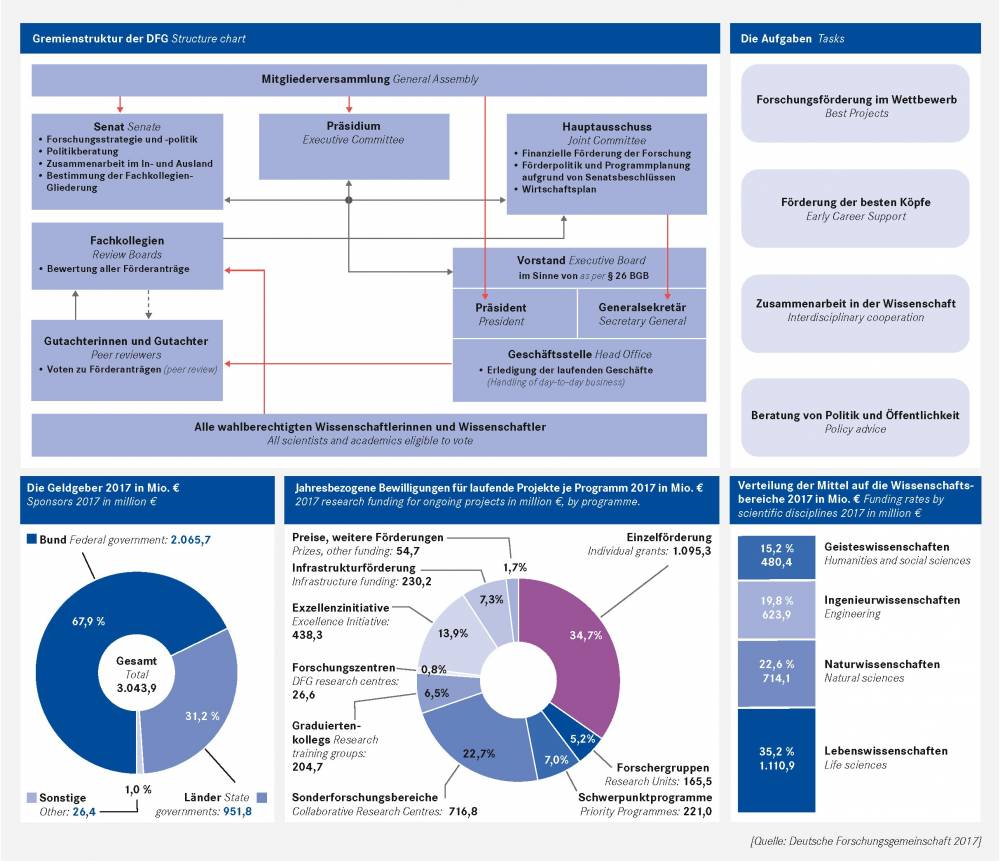
The German Research Foundation (DFG) is the self-governing organisation for science and research in Germany and the most important funding body for basic research at universities, non-university research institutions, scientific associations, and the Academies of Science and the Humanities. Even though the DFG receives the vast majority of its funds from the federal government (68 %) and the state governments (31 %), in organisational terms, it is an association under private law. Applications for DFG research funding are reviewed in a multi-step decision-making process, beginning with an assessment by peer reviewers who serve in an honorary capacity. Their statements, which are guided solely by scientific criteria, then serve as the basis for subsequent decisions by the elected members of the review board and the DFG grants committee. By funding Collaborative Research Centres, research training groups, and the so-called “Excellence Initiative”, the DFG has had a major impact on the re-structuring of the German higher education sector.
35. The Max Planck Society
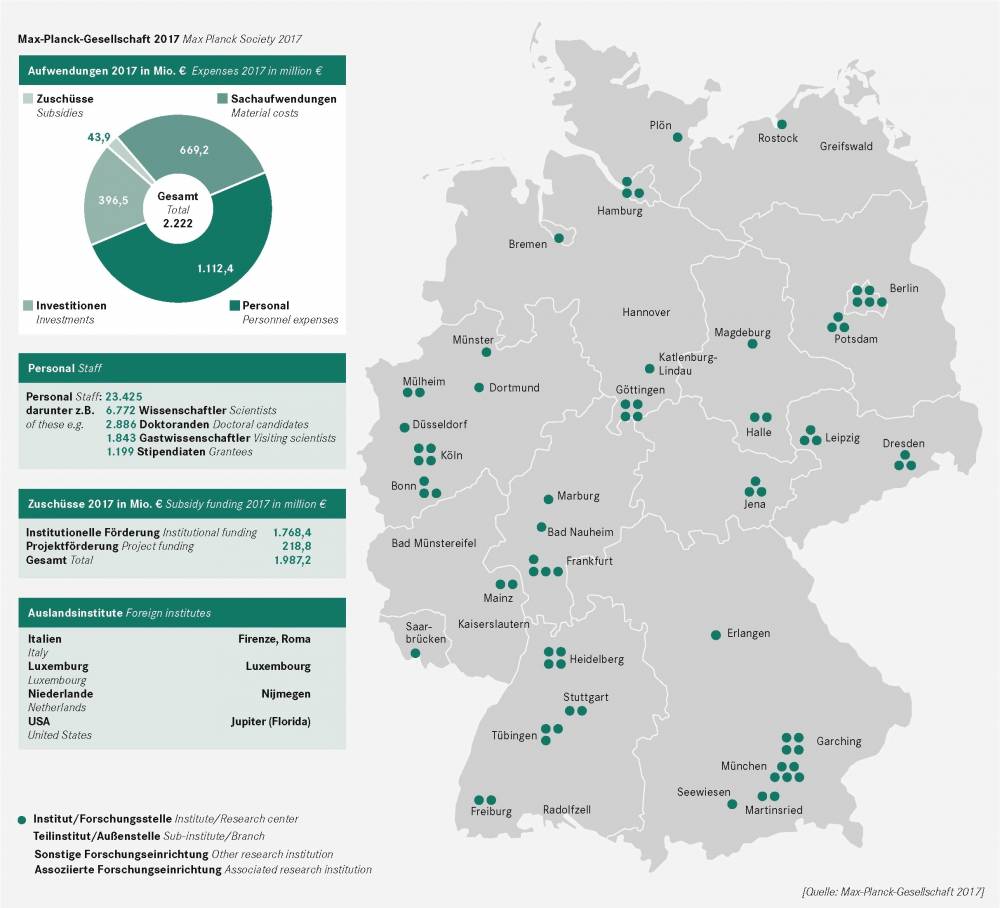
The Max Planck Society is Germany’s most successful research organisation. Since its establishment in 1948, no fewer than 18 Nobel laureates have emerged from the ranks of its scientists. The Max Planck Institutes conduct basic research in the natural sciences, life sciences, social sciences, and the humanities. Around 23,500 staff members work in the 84 Max Planck Institutes. Five of its institutes are located abroad: two in Italy, one in the Netherlands, in the USA, and in Luxembourg. The results of the research work from Max Planck Institutes are published each year in approx. 15,000 articles in internationally renowned scientific journals. The scientific attractiveness of the Max Planck Society is based on its understanding of research: Max Planck Institutes are built up solely around the world’s leading researchers who themselves define their research priorities and are given the best working conditions.
36. The Helmholtz Association of German Research Centers
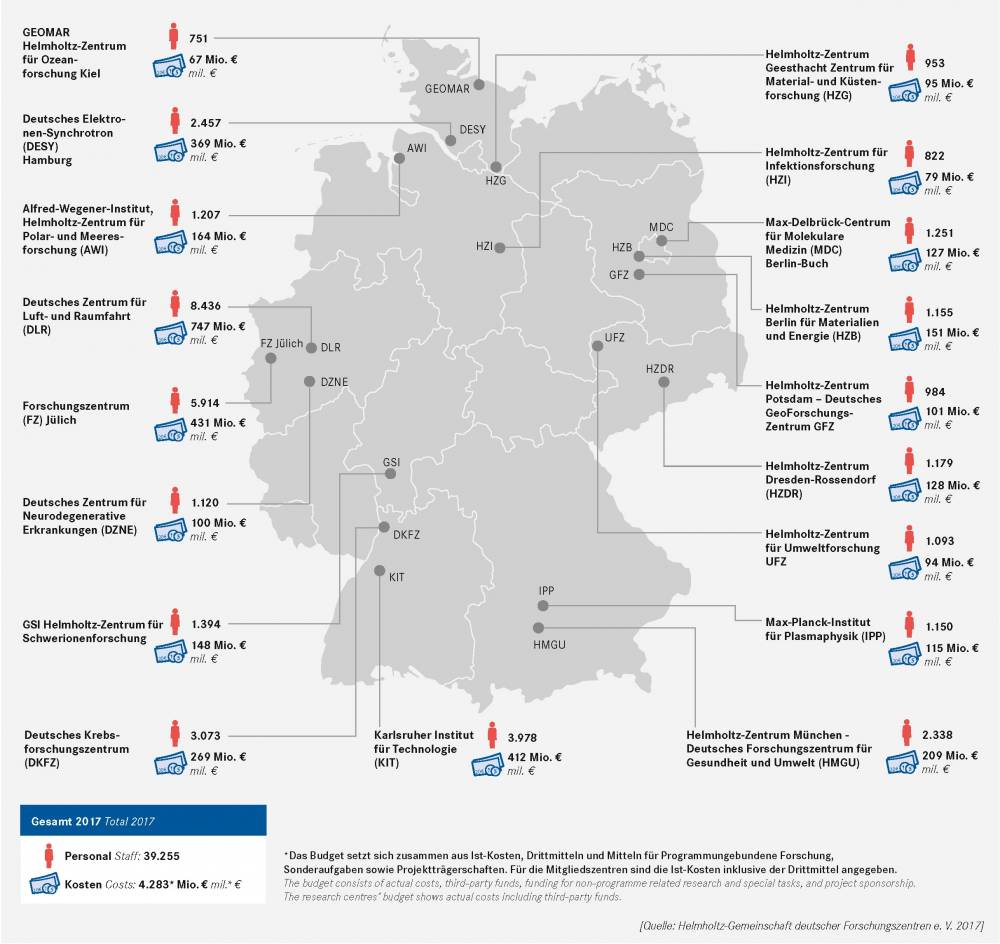
With 39,255 staff at 18 Helmholtz Research Centres and an annual budget of 4.56 billion € Helmholtz is Germany’s largest scientific organisation. Helmholtz contributes to solving the major challenges facing society, science and the economy by conducting top-level research in strategic programmes within our six research fields: Energy, Earth and Environment, Health, Aeronautics, Space and Transport, Matter, and Key Technologies (in the future: Information). The Association’s special responsibilities include operating major research equipment such as particle accelerators, research ships and satellites, but also conducting large-scale projects in health research. Its work follows in the tradition of the great natural scientist Hermann von Helmholtz (1821−1894).
37. The Leibniz Association
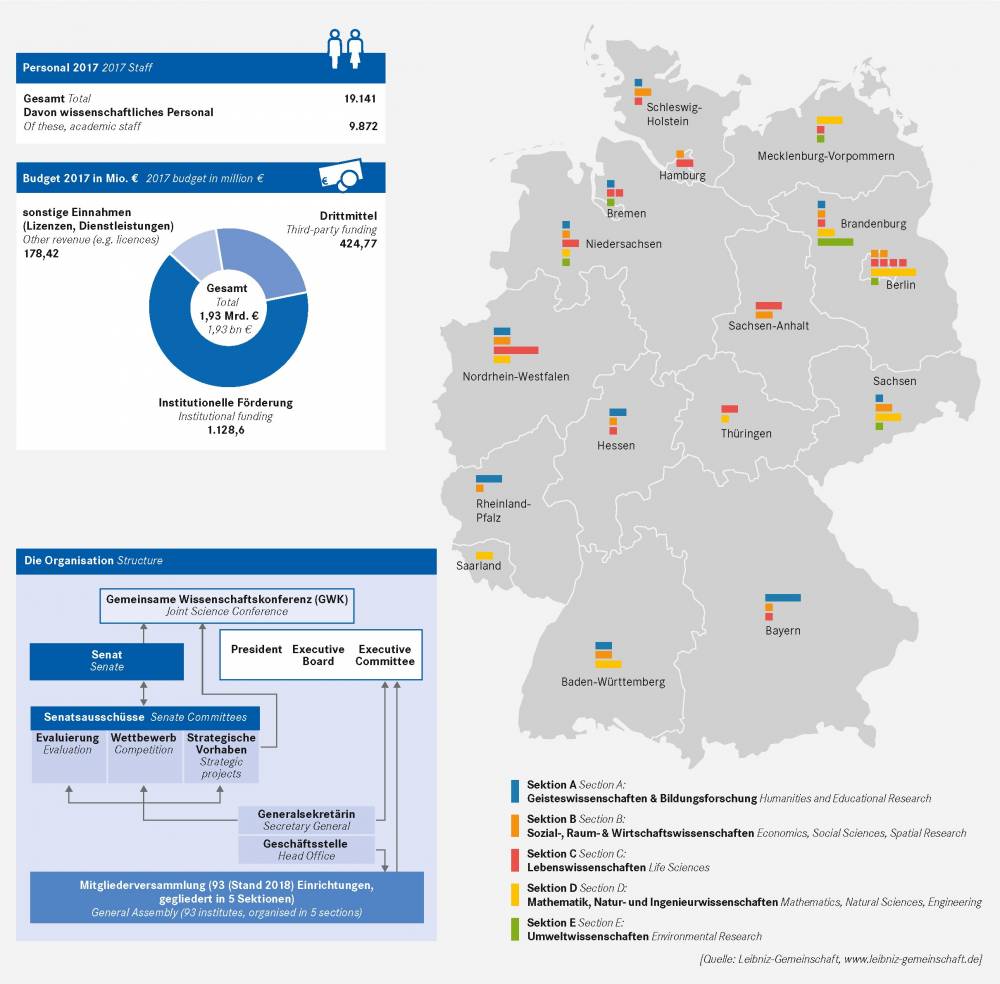
The Leibniz Association connects 93 independent research institutions from a diverse range of academic disciplines. It is named after Gottfried Wilhelm Leibniz (1646−1716), a universally educated scholar whose motto “theoria cum praxi” − science for the benefit of humanity − is of special importance to the Association. In addition to performing knowledge-driven and applied basic research, the Leibniz institutes maintain scientific infrastructure, provide research-based services, and are thoroughly engaged in knowledge transfer, e.g. through research-based policy advising or the eight Leibniz research museums. The goals of this kind of self-organisation include strengthening collaboration among member institutions, exchanging information and experience and representing their joint interests with regard to research policy.
38. The Fraunhofer-Gesellschaft
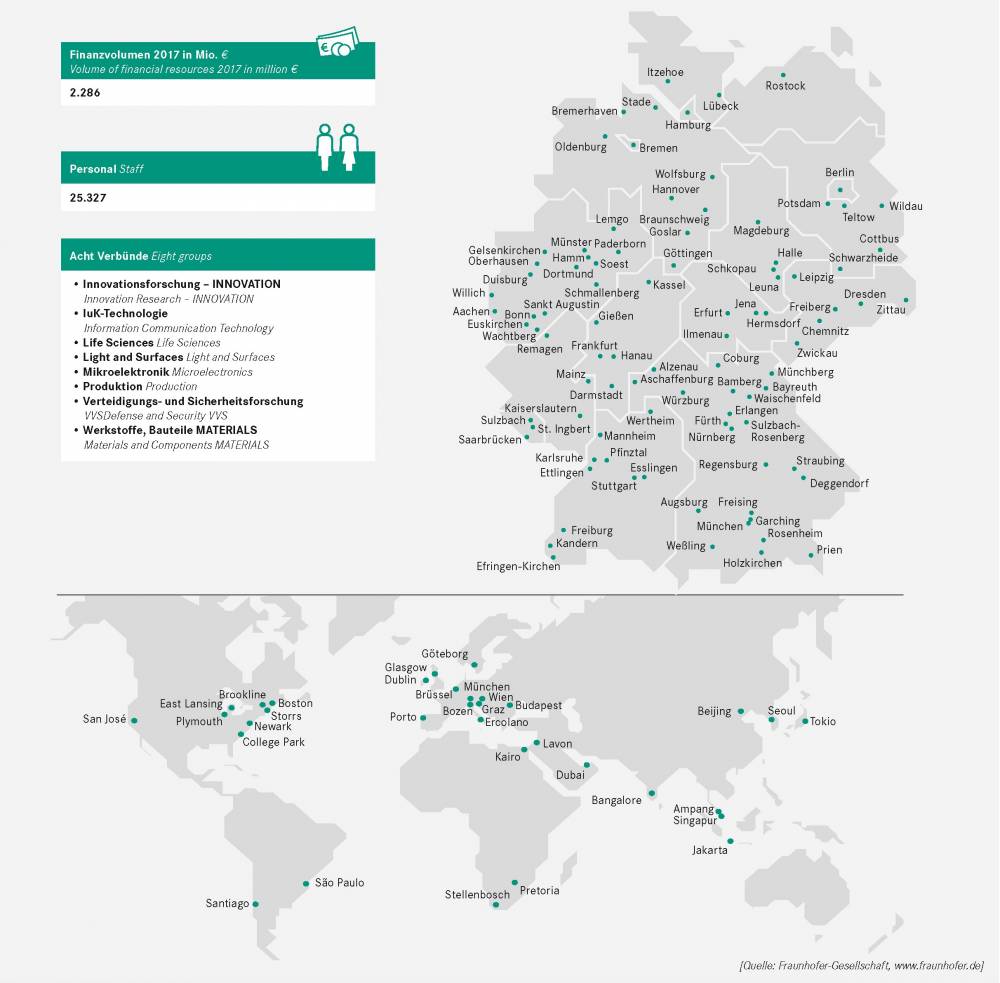
The Fraunhofer-Gesellschaft is the leading organisation for applied research in Europe. Its research activities are conducted by 72 institutes and independent research units at locations throughout Germany. The Fraunhofer-Gesellschaft employs a staff of more than 25,000. Its annual volume of financial resources amounted to € 2.3 billion in 2017. 60 % of this sum is generated through contract research on behalf of industry and publicly funded research projects.
Worldwide branch offices serve to promote international cooperation. The Fraunhofer-Gesellschaft is a recognised non-profit organisation that takes its name from Joseph von Fraunhofer (1787−1826), the illustrious Munich researcher, inventor and entrepreneur.
References of data and information for charts
Chart 1: Deutschland in Zahlen
Land:
•Statistisches Bundesamt, Statistisches Jahrbuch 2018, Link: https://www.destatis.de/DE/Publikationen/StatistischesJahrbuch/StatistischesJahrbuch2018.pdf?__blob=publicationFile, zuletzt abgerufen am 22.10.2018
•Agrar- und Waldfläche sowie Gesamtfläche: S. 686
•Städte und Einwohnerzahlen: S. 30 ff.
Bevölkerung:
•Statistisches Bundesamt, Bevölkerung nach Geschlecht und Staatsangehörigkeit, 31.03.2018, Link: https://www.destatis.de/DE/ZahlenFakten/GesellschaftStaat/Bevoelkerung/Bevoelkerungsstand/Tabellen/Zensus_Geschlecht_Staatsangehoerigkeit.html, zuletzt abgerufen am 22.10.2018
•Statistisches Bundesamt, Bevölkerung nach Altersgruppen, Familienstand und Religionszugehörigkeit, Link: https://www.destatis.de/DE/ZahlenFakten/GesellschaftStaat/Bevoelkerung/Bevoelkerungsstand/Tabellen/AltersgruppenFamilienstandZensus.html, zuletzt abgerufen am 22.10.2018
Wirtschaft:
•Statistisches Bundesamt, Statistisches Jahrbuch 2018, Link: https://www.destatis.de/DE/Publikationen/StatistischesJahrbuch/StatistischesJahrbuch2018.pdf?__blob=publicationFile, zuletzt abgerufen am 22.10.2018
•Erwerbstätige: S. 332
•Arbeitslosenquote: S. 373
•Bruttowertschöpfung: S. 329
•Infrastruktur: S. 607
Bildung und Ausbildung:
•Statistisches Bundesamt, Statistisches Jahrbuch 2018, Link: https://www.destatis.de/DE/Publikationen/StatistischesJahrbuch/StatistischesJahrbuch2018.pdf?__blob=publicationFile, zuletzt abgerufen am 22.10.2018
•Schulen: S. 93
•Lehrer: S. 366
•OECD/ILO/UIS (2017), Education at a Glance Database, http://stats.oecd.org/. See Source section for more information and Annex 3 for notes (www.oecd.org/education/education-at-a-glance-19991487.htm).
•Bildungsabschlüsse (http://dx.doi.org/10.1787/888933556957)
Kultur:
•Deutsche UNESCO-Kommission, Welterbe in Deutschland, Link: https://www.unesco.de/kultur-und-natur/welterbe/welterbe-deutschland, zuletzt abgerufen am 22.10.2018
•Deutscher Bühnenverein, Theaterstatistik Summentabellen, September 2018, Link: http://www.buehnenverein.de/de/publikationen-und-statistiken/statistiken/theaterstatistik.html?cmsDL=7c0eb0efe708d8ae3d7cd12bb48240a4, zuletzt abgerufen am 22.10.2018
•FFA, Das Kinoergebnis 2017 Link: http://www.ffa.de/download.php?f=70c43f4d0fce1841906d3be3b12d7f0d&target=0, zuletzt abgerufen am 22.10.2018
•Institut für Museumsforschung, Statistische Gesamterhebung an den Museen der Bundesrepublik Deutschland für das Jahr 2016, Dezember 2017, Link: http://www.smb.museum/fileadmin/website/Institute/Institut_fuer_Museumsforschung/Publikationen/Materialien/mat71.pdf, S. 27, zuletzt abgerufen am 22.10.2018
•Deutscher Bibliotheksverband, Deutsche Bibliotheksstatistik (DBS), Gesamtauswertung Berichtsjahr 2017, September 2018, Link: https://wiki1.hbz-nrw.de/download/attachments/99811333/dbs_gesamt_dt_2017.pdf?version=1&modificationDate=1535445536618, zuletzt abgerufenam 22.10.2018
Chart 2: Grundstruktur des Bildungswesens in Deutschland
Deutscher Akademischer Austauschdienst: Eigene Darstellung
Chart 3: Das nationale Budget für Bildung, Forschung und Wissenschaft
•Statistisches Bundesamt, Volkswirtschaftliche Gesamtrechnung, Inlandsproduktberechnung, Lange Reihen ab 1970, Fachserie 18, Reihe 1.5 – 2017
(Stand: August 2018), S. 14, Link: https://www.destatis.de/DE/Publikationen/Thematisch/VolkswirtschaftlicheGesamtrechnungen/Inlandsprodukt/InlandsproduktsberechnungLangeReihenPDF_2180150.pdf?__blob=publicationFile, zuletzt abgerufen am 08.11.2018
•Statistisches Bundesamt, Bildungsausgaben, Budget für Bildung, Forschung und Wissenschaft 2015/16 (Ausgabe 2018), S. 13 f., Link: https://www.destatis.de/DE/Publikationen/Thematisch/BildungForschungKultur/BildungKulturFinanzen/BildungsausgabenPDF_5217108.pdf?__blob=publicationFile, zuletzt abgerufen am 08.11.2018
Chart 4: Die verschiedenen Hochschularten
•Statistisches Bundesamt, Bildung und Kultur, Studierende an Hochschulen – Fachserie 11 Reihe 4.1 – Wintersemester 2017/2018, Link: https://www.destatis.de/DE/Publikationen/Thematisch/BildungForschungKultur/Hochschulen/StudierendeHochschulenEndg2110410187004.pdf?__blob=publicationFile, zuletzt abgerufen am 17.10.2018
•Hochschularten: S. 12
•Studierenden nach Hochschularten: S. 54
Chart 5: Unterschiede zwischen Universitäten und Fachhochschulen
•Statistisches Bundesamt, Bildung und Kultur, Studierende an Hochschulen – Fachserie 11 Reihe 4.1 – Wintersemester 2017/2018, Link: https://www.destatis.de/DE/Publikationen/Thematisch/BildungForschungKultur/Hochschulen/StudierendeHochschulenEndg2110410187004.pdf?__blob=publicationFile, zuletzt abgerufen am 17.10.2018
Chart 6: Öffentliche, private und kirchliche Hochschulen in Deutschland
•Statistisches Bundesamt, Bildung und Kultur, Studierende an Hochschulen – Fachserie 11 Reihe 4.1 – Wintersemester 2017/2018, S. 54 Link: https://www.destatis.de/DE/Publikationen/Thematisch/BildungForschungKultur/Hochschulen/StudierendeHochschulenEndg2110410187004.pdf?__blob=publicationFile, zuletzt abgerufen am 21.11.2018
•Statistisches Bundesamt, H201 – Hochschulstatistik, Anzahl der Hochschulen nach Land und Trägerschaft im Wintersemester 2017/2018
Chart 7: Größenordnung deutscher Hochschulen:
Linke Grafik: Die Top 20 der am stärksten besuchten Hochschulen in Deutschland
•Statistisches Bundesamt, Bildung und Kultur, Studierende an Hochschulen – Fachserie 11 Reihe 4.1 – Wintersemester 2017/2018, S. 39, Link: https://www.destatis.de/DE/Publikationen/Thematisch/BildungForschungKultur/Hochschulen/StudierendeHochschulenEndg2110410187004.pdf?__blob=publicationFile, zuletzt abgerufen am 09.11.2018
Rechte obere Grafik: Die zehn Städte mit den größten Studierendenzahlen
•Statistisches Bundesamt, Bildung und Kultur, Studierende an Hochschulen – Fachserie 11 Reihe 4.1 – Wintersemester 2017/2018, S. 63 ff., Link: https://www.destatis.de/DE/Publikationen/Thematisch/BildungForschungKultur/Hochschulen/StudierendeHochschulenEndg2110410187004.pdf?__blob=publicationFile, zuletzt abgerufen am 09.11.2018
Rechte untere Grafik: Die zehn Städte mit dem größten Studierendenanteil
•Statistisches Bundesamt, Bildung und Kultur, Studierende an Hochschulen – Fachserie 11 Reihe 4.1 – Wintersemester 2017/2018, S. 63 ff., Link: https://www.destatis.de/DE/Publikationen/Thematisch/BildungForschungKultur/Hochschulen/StudierendeHochschulenEndg2110410187004.pdf?__blob=publicationFile, zuletzt abgerufen am 09.11.2018
•Statistisches Bundesamt, Zahlen und Fakten, Länder und Regionen, Städte (Alle Gemeinden mit Stadtrecht) nach Fläche, Bevölkerung und Bevölkerungsdichte am 31.12.2017, Link: https://www.destatis.de/DE/ZahlenFakten/LaenderRegionen/Regionales/Gemeindeverzeichnis/Administrativ/Aktuell/05Staedte.html, zuletzt abgerufen am 26.10.2018
Siehe auch https://www.studis-online.de/Studieren/studentenstatistik.php#studentenstaedte-relativ
Chart 8: Gründungsdaten der größten deutschen Hochschulen
•Hochschulrektorenkonferenz (HRK), Hochschulkompass – Ein Angebot der Hochschulrektorenkonferenz, Link: https://www.hochschulkompass.de/home.html, zuletzt abgerufen am 20.11.2018
•Über die Suche nach Hochschulen gelangt man zu den Steckbriefen der einzelnen Hochschulen, bei denen auch das Gründungsjahr angegeben ist
Chart 9: Deutsche Hochschulen und Studienangebote im Ausland
Deutscher Akademischer Austauschdienst, Jahresbericht 2017
Chart 10: Die Zulassung zum Studium an Universitäten
Deutscher Akademischer Austauschdienst, Abteilung Strategie: Eigene Darstellung
Chart 11: Der Aufbau des Hochschulstudiums
Deutscher Akademischer Austauschdienst, Abteilung Strategie: Eigene Darstellung
Chart 12: Die soziale Dimension des Studiums (2016)
Obere, linke Grafik: Die soziale Herkunft der Eltern
•Bundesministerium für Bildung und Forschung, Die wirtschaftliche und soziale Lage der Studierenden in Deutschland 2016, 21. Sozialerhebung des Deutschen Studentenwerks, durchgeführt vom Deutschen Zentrum für Hochschul- und Wissenschaftsforschung, S. 27 f., Link: http://www.sozialerhebung.de/download/21/Soz21_hauptbericht.pdf, zuletzt abgerufen am 05.11.2018
Obere, rechte Grafik: Wie Studierende wohnen (in %)
•Bundesministerium für Bildung und Forschung, Die wirtschaftliche und soziale Lage der Studierenden in Deutschland 2016, 21. Sozialerhebung des Deutschen Studentenwerks, durchgeführt vom Deutschen Zentrum für Hochschul- und Wissenschaftsforschung, S. 64, Link: http://www.sozialerhebung.de/download/21/Soz21_hauptbericht.pdf, zuletzt abgerufen am 05.11.2018
Untere Grafik: Lebenshaltungskosten: ausgewählte Ausgabepositionen (in €)
•Bundesministerium für Bildung und Forschung, Die wirtschaftliche und soziale Lage der Studierenden in Deutschland 2016, 21. Sozialerhebung des Deutschen Studentenwerks, durchgeführt vom Deutschen Zentrum für Hochschul- und Wissenschaftsforschung, S. 43, Link: http://www.sozialerhebung.de/download/21/Soz21_hauptbericht.pdf, zuletzt abgerufen am 05.11.2018
Untere, rechte Grafik: Wie das Studium finanziert wird (in %)
•Bundesministerium für Bildung und Forschung, Die wirtschaftliche und soziale Lage der Studierenden in Deutschland 2016, 21. Sozialerhebung des Deutschen Studentenwerks, durchgeführt vom Deutschen Zentrum für Hochschul- und Wissenschaftsforschung, S. 48, Link: http://www.sozialerhebung.de/download/21/Soz21_hauptbericht.pdf, zuletzt abgerufen am 05.11.2018
Chart 13: Die Ausbildungsförderung für Studierende 2017/18 (BAföG)
•Pressemitteilung Destatis (https://www.destatis.de/DE/PresseService/Presse/Pressemitteilungen/2018/08/PD18_284_214.html)
•Publikation „Das BAföG – Kompaktinformation zur Ausbildungsförderung“, Bundesministerium für Bildung und Forschung, August 2018, https://www.bmbf.de/de/das-wissenschaftssystem-143.html
Chart 14: Der Anstieg der Studierendenzahlen seit 1960
Obere Grafik: Studierende und Studienanfänger seit 1960
•Bundesministerium für Bildung und Forschung, Daten, Bildung, Hochschulen, 2.5.4 Studierende, „Tab 2.5.23: Studierende insgesamt und deutsche Studierende nach Hochschularten; Zeitreihe: 1947/1948–2017/2018“, Link: http://www.datenportal.bmbf.de/portal/de/Tabelle-2.5.23.html, zuletzt abgerufen am 17.10.2018
•Statistisches Bundesamt, Bildung und Kultur, Nichtmonetäre hochschulstatistische Kennzahlen 1980–2016, Fachserie 11, Reihe 4.3.1., Link: https://www.destatis.de/DE/Publikationen/Thematisch/BildungForschungKultur/Hochschulen/KennzahlenNichtmonetaer2110431167004.pdf?__blob=publicationFile
•Studienanfänger: S. 129
Untere Grafik: Anteil der Studienberechtigten
•Statistisches Bundesamt, Bildung und Kultur, Nichtmonetäre hochschulstatistische Kennzahlen 1980–2017, Fachserie 11, Reihe 4.3.1., Link: https://www.destatis.de/DE/Publikationen/Thematisch/BildungForschungKultur/Hochschulen/KennzahlenNichtmonetaer2110431177004.pdf?__blob=publicationFile
•Studienberechtigte (Quote): S. 115
•Daten ab 1975 bis 1994: S. 15
•Deutschland in Zahlen, Studienberechtigungsquote in Prozent, Link: https://www.deutschlandinzahlen.de/tab/bundeslaender/bildung/hochschule/studierende/studienberechtigtenquote, zuletzt abgerufen am 17.10.2018
•Studienberechtigte ab 1980 bis 1995: S. 7
•Bundesministerium für Bildung und Forschung, Daten, Bildung, Hochschulen, 2.5.2 Studienberechtigte, „Tab 2.5.85: Anteil der Studienberechtigten an der altersspezifischen Bevölkerung (Studienberechtigtenquote) nach Art der Hochschulreife; Zeitreihe: 1975–2016“ Link: http://www.datenportal.bmbf.de/portal/de/Tabelle-2.5.85.html, zuletzt abgerufen am 17.10.2018
http://www.datenportal.bmbf.de/portal/de/K253.html
Chart 15: Wer studiert was? Die Fächergruppenverteilung im Wintersemester 2017/18
Obere Grafik: Fächerverteilung nach Hochschulart
•Statistisches Bundesamt, Bildung und Kultur, Studierende an Hochschulen – Fachserie 11 Reihe 4.1 – Wintersemester 2017/2018, Link: https://www.destatis.de/DE/Publikationen/Thematisch/BildungForschungKultur/Hochschulen/StudierendeHochschulenEndg2110410187004.pdf?__blob=publicationFile, zuletzt abgerufen am 17.10.2018
•Fächerverteilung nach Hochschulart: S. 46 ff.
Untere Grafik: Fächerverteilung nach Geschlechtern
•Statistisches Bundesamt, Bildung und Kultur, Studierende an Hochschulen – Fachserie 11 Reihe 4.1 – Wintersemester 2017/2018, Link: https://www.destatis.de/DE/Publikationen/Thematisch/BildungForschungKultur/Hochschulen/StudierendeHochschulenEndg2110410187004.pdf?__blob=publicationFile, zuletzt abgerufen am 17.10.2018
•Fächerverteilung nach Geschlecht: S. 44 ff.
Untere, rechte Grafik: Promotionen ausländischer Wissenschaftler/innen in Deutschland nach wichtigsten Herkunftsländern 2016
•Statistisches Bundesamt, Bildung und Kultur, Prüfungen an Hochschulen – Fachserie 11 Reihe 4.2 – 2017, S. 31, Link: https://www.destatis.de/DE/Publikationen/Thematisch/BildungForschungKultur/Hochschulen/PruefungenHochschulen2110420177004.pdf?__blob=publicationFile, zuletzt abgerufen am 05.10.2018
Chart 16: Ausländische Studierende an deutschen Hochschulen
Obere Grafik: Ausländische Studierende
•Quelle: Statistisches Bundesamt, Bildung und Kultur, Studierende an Hochschulen – Fachserie 11 Reihe 4.1 – Wintersemester 2017/2018, Link: https://www.destatis.de/DE/Publikationen/Thematisch/BildungForschungKultur/Hochschulen/StudierendeHochschulenEndg2110410187004.pdf?__blob=publicationFile, zuletzt abgerufen am 14.10.2018
•Gesamt 2016/17 und 2017/18: S. 12
•Bildungsausländer 2017/18: S. 412
•Bildungsinländer 2017/18: S. 59, 408
•Statistisches Bundesamt, Bildung und Kultur, Studierende an Hochschulen – Fachserie 11 Reihe 4.1 – Wintersemester 2016/2017 Link: https://www.destatis.de/DE/Publikationen/Thematisch/BildungForschungKultur/Hochschulen/StudierendeHochschulenEndg2110410177004.pdf?__blob=publicationFile, zuletzt abgerufen am 14.10.2018
•Bildungsausländer 2016/17: S. 58
•Bildungsinländer 2016/17: S. 60
•DAAD, Wissenschaft Weltoffen 2017, S. 42, Link: http://www.wissenschaftweltoffen.de/publikation/wiwe_2017_verlinkt.pdf, zuletzt abgerufen am 14.10.2018
•DAAD, Wissenschaft Weltoffen 2014, S. 8, Link: http://www.wissenschaftweltoffen.de/publikation/wiwe_2014_verlinkt.pdf, zuletzt abgerufen am 14.10.2018
•Statistisches Bundesamt, Bildung und Kultur, Studierende an Hochschulen – Fachserie 11 Reihe 4.1 – Wintersemester 2014/2015, Link: https://www.destatis.de/DE/Publikationen/Thematisch/BildungForschungKultur/Hochschulen/StudierendeHochschulenEndg2110410157004.pdf?__blob=publicationFile, zuletzt abgerufen am 14.10.2018
•Bildungsinländer 2001/2002 bis 2015/16
Untere, linke Grafik: Bildungsausländer aus den wichtigsten Herkunftsländern (Top 20)
•Statistisches Bundesamt, Bildung und Kultur, Studierende an Hochschulen – Fachserie 11 Reihe 4.1 – Wintersemester 2017/2018, Link: https://www.destatis.de/DE/Publikationen/Thematisch/BildungForschungKultur/Hochschulen/StudierendeHochschulenEndg2110410187004.pdf?__blob=publicationFile, zuletzt abgerufen am 14.10.2018
•Bildungsausländer 2017/18: S. 57
Untere, rechte Grafik: Bildungsausländer nach Fächergruppen:
•DAAD, Wissenschaft Weltoffen, 2018, S. 56, Link: http://www.wissenschaftweltoffen.de/publikation/wiwe_2018_verlinkt.pdf, zuletzt abgerufen am 10.10.2018
Chart 17: Deutsche Studierende im Ausland
Obere Grafik: Anzahl deutscher Studierender im Ausland 1995 bis 2015
•DAAD, Wissenschaft Weltoffen, 2018, S. 87, Link: http://www.wissenschaftweltoffen.de/publikation/wiwe_2018_verlinkt.pdf, zuletzt abgerufen am 10.10.2018
•Statistisches Bundesamt, Deutsche Studierende im Ausland, S. 11, Link: https://www.destatis.de/DE/Publikationen/Thematisch/BildungForschungKultur/Hochschulen/StudierendeAusland5217101187004.pdf;jsessionid=B8F1CE85F41CD92D3F18ED4F48A43C4D.InternetLive2?__blob=publicationFile zuletzt abgerufen am 05.02.2019
Untere, linke Grafik: Gastländer deutscher Studierender 2015
•DAAD, Wissenschaft Weltoffen, 2018, S. 87, Link: http://www.wissenschaftweltoffen.de/publikation/wiwe_2018_verlinkt.pdf, zuletzt abgerufen am 10.10.2018
Untere, rechte Grafik: Deutsche Studierende im Ausland nach Fächergruppen 2015
•DAAD, Wissenschaft Weltoffen, 2018, S. 91, Link: http://www.wissenschaftweltoffen.de/publikation/wiwe_2018_verlinkt.pdf, zuletzt abgerufen am 10.10.2018
Chart 18: Erasmus+: Gast- und Zielländer deutscher und ausländischer Studierender in Europa
Deutscher Akademischer Austauschdienst, Erasmus-Statistik, Sonderauswertung
Chart 19: Die Promotion
Obere, linke Grafik: Zahl der Promotionen 1980–2017
•Statistisches Bundesamt, Bildung und Kultur, Prüfungen an Hochschulen – Fachserie 11 Reihe 4.2 – 2017, S. 11, Link: https://www.destatis.de/DE/Publikationen/Thematisch/BildungForschungKultur/Hochschulen/PruefungenHochschulen2110420177004.pdf?__blob=publicationFile, zuletzt abgerufen am 05.10.2018
Obere, rechte Grafik: Promotionen nach Fächergruppe 2017
•Statistisches Bundesamt, Bildung und Kultur, Prüfungen an Hochschulen – Fachserie 11 Reihe 4.2 – 2017, S. 16, Link: https://www.destatis.de/DE/Publikationen/Thematisch/BildungForschungKultur/Hochschulen/PruefungenHochschulen2110420177004.pdf?__blob=publicationFile, zuletzt abgerufen am 05.10.2018
Untere, linke Grafik: Promotionsquote in ausgewählten Ländern 2017
•OECD, Education at a Glance 2018, S. 48 Link: https://www.oecd-ilibrary.org/docserver/eag-2018-en.pdf?expires=1539524384&id=id&accname=ocid41021573&checksum=9C4283504905E3E36A97B3FF3B5F4D2B
•Tabelle: https://doi.org/10.1787/888933801677
Chart 20: Die Habilitation – der Weg zur Professur
Linke Grafik: Habilitationsquote
•Statistisches Bundesamt, Bildung und Kultur, Nichtmonetäre hochschulstatistische Kennzahlen 1980–2017, Fachserie 11, Reihe 4.3.1., Link: https://www.destatis.de/DE/Publikationen/Thematisch/BildungForschungKultur/Hochschulen/KennzahlenNichtmonetaer2110431177004.pdf?__blob=publicationFile, zuletzt abgerufen am 22.10.2018
•Berechnung durch Promotionen in 2010 und Habilitationen in 2017: S. 622
Mittlere Grafik: Zahl der Habilitationen
•Statistisches Bundesamt, Bildung und Kultur, Nichtmonetäre hochschulstatistische Kennzahlen 1980–2017, Fachserie 11, Reihe 4.3.1., Link: https://www.destatis.de/DE/Publikationen/Thematisch/BildungForschungKultur/Hochschulen/KennzahlenNichtmonetaer2110431177004.pdf?__blob=publicationFile, zuletzt abgerufen am 22.10.2018
•Anzahl: S. 622
Rechte Grafik: Frauenanteil
•Statistisches Bundesamt, Bildung und Kultur, Nichtmonetäre hochschulstatistische Kennzahlen 1980–2017, Fachserie 11, Reihe 4.3.1., Link: https://www.destatis.de/DE/Publikationen/Thematisch/BildungForschungKultur/Hochschulen/KennzahlenNichtmonetaer2110431177004.pdf?__blob=publicationFile, zuletzt abgerufen am 22.10.2018
•Frauenanteil: S. 622
Chart 21: Das Personal der Hochschule
Obere Grafik: Personal an Hochschulen
•Statistisches Bundesamt, Bildung und Kultur, Personal an Hochschulen, Fachserie 11, Reihe 4.4, 2017, Link: https://www.destatis.de/DE/Publikationen/Thematisch/BildungForschungKultur/Hochschulen/PersonalHochschulen2110440177004.pdf?__blob=publicationFile, zuletzt abgerufen am 28.10.2018
•S. 22 f.
Untere Grafik: Hauptberufliches Personal nach Fächergruppen
•Statistisches Bundesamt, Bildung und Kultur, Personal an Hochschulen, Fachserie 11, Reihe 4.4, 2017, Link: https://www.destatis.de/DE/Publikationen/Thematisch/BildungForschungKultur/Hochschulen/PersonalHochschulen2110440177004.pdf?__blob=publicationFile, zuletzt abgerufen am 28.10.2018
•S. 24 f.
Chart 22: Frauenanteil an deutschen Hochschulen
Obere Grafik: Anteil der Frauen an deutschen Hochschulen 2017
•Statistisches Bundesamt, Bevölkerung nach Geschlecht und Staatsangehörigkeit, 31.03.2018, Link: https://www.destatis.de/DE/ZahlenFakten/GesellschaftStaat/Bevoelkerung/Bevoelkerungsstand/Tabellen/Zensus_Geschlecht_Staatsangehoerigkeit.html, zuletzt abgerufen am 22.10.2018
•Statistisches Bundesamt, Bildung und Kultur, Prüfungen an Hochschulen Fachserie 11 Reihe, 2017, Link: https://www.destatis.de/DE/Publikationen/Thematisch/BildungForschungKultur/Hochschulen/PruefungenHochschulen2110420177004.pdf?__blob=publicationFile
•Absolventinnen, Promotionen: S. 11
•Statistisches Bundesamt, Bildung und Kultur, Personal an Hochschulen – Fachserie 11 Reihe 4.4 – 2017, Link: https://www.destatis.de/DE/Publikationen/Thematisch/BildungForschungKultur/Hochschulen/PersonalHochschulen2110440177004.pdf?__blob=publicationFile, zuletzt abgerufen am 22.10.2018
•Professorinnen, wissenschaftliche und künstlerische Mitarbeiterinnen: S. 22
•Statistisches Bundesamt, Bildung und Kultur, Studierende an Hochschulen – Fachserie 11 Reihe 4.1 – Wintersemester 2017/2018, Link: https://www.destatis.de/DE/Publikationen/Thematisch/BildungForschungKultur/Hochschulen/StudierendeHochschulenEndg2110410187004.pdf?__blob=publicationFile, zuletzt abgerufen am 17.10.2018
•Studienanfänger und Studierende: S. 14 ff.
•Statistisches Bundesamt, Bildung und Kultur, Nichtmonetäre hochschulstatistische Kennzahlen 1980–2017, Fachserie 11, Reihe 4.3.1., Link: https://www.destatis.de/DE/Publikationen/Thematisch/BildungForschungKultur/Hochschulen/KennzahlenNichtmonetaer2110431177004.pdf?__blob=publicationFile, zuletzt abgerufen am 22.10.2018
•Frauenanteil: S. 622
Untere Grafik: Frauenanteil der Professorenschaft an Hochschulen nach Fächergruppen 2017
•Statistisches Bundesamt, Bildung und Kultur, Personal an Hochschulen – Fachserie 11 Reihe 4.4 – 2017, Link: https://www.destatis.de/DE/Publikationen/Thematisch/BildungForschungKultur/Hochschulen/PersonalHochschulen2110440177004.pdf?__blob=publicationFile, zuletzt abgerufen am 22.10.2018
•Frauenanteil unter den Professoren: S. 273 ff.
•Habilitationen: S. 95
Chart 23: Ausländisches Wissenschaftspersonal in Deutschland
Obere, linke Grafik:
•Statistisches Bundesamt, Bildung und Kultur, Personal an Hochschulen – Fachserie 11 Reihe 4.4 – 2017, S. 18, Link: https://www.destatis.de/DE/Publikationen/Thematisch/BildungForschungKultur/Hochschulen/PersonalHochschulen2110440177004.pdf;jsessionid=9C0AE049E28FDF67BD430AFB712B9D2D.InternetLive1?__blob=publicationFile, zuletzt abgerufen am 29.01.2019
•DAAD, Wissenschaft Weltoffen kompakt, 2018, Abb. 25, Link: http://www.wissenschaftweltoffen.de/kompakt/wwo2018_kompakt_de.pdf, zuletzt abgerufen am 29.01.2019
•DAAD, Wissenschaft Weltoffen kompakt, 2019, Abb. 25, zum Zeitpunkt der Drucklegung noch unveröffentlicht
Obere, rechte Grafik:
•Statistisches Bundesamt, Finanzen und Steuern, Ausgaben, Einnahmen und Personal der öffentlichen und öffentlich geförderten Einrichtungen für Wissenschaft, Forschung und Entwicklung – Fachserie 14 Reihe 3.6 – 2016, S. 40ff., Link: https://www.destatis.de/DE/Publikationen/Thematisch/BildungForschungKultur/Forschung/AusgabenEinnahmenPersonal2140360167004.pdf?__blob=publicationFile, zuletzt abgerufen am 29.01.2019
•DAAD, Wissenschaft Weltoffen kompakt, 2018, Abb. 26, Link: http://www.wissenschaftweltoffen.de/kompakt/wwo2018_kompakt_de.pdf, zuletzt abgerufen am 29.01.2019
•DAAD, Wissenschaft Weltoffen, 2018, S. 119, Link: http://www.wissenschaftweltoffen.de/publikation/wiwe_2018_verlinkt.pdf, zuletzt abgerufen am 29.01.2019
Mittlere, rechte Grafik:
•DAAD, Wissenschaft Weltoffen, 2018, S. 111, Link: http://www.wissenschaftweltoffen.de/publikation/wiwe_2018_verlinkt.pdf, zuletzt abgerufen am 29.01.2019
•DAAD, Wissenschaft Weltoffen, 2018, S. 119, Link: http://www.wissenschaftweltoffen.de/publikation/wiwe_2018_verlinkt.pdf, zuletzt abgerufen am 29.01.2019
Untere Grafik:
•DAAD, Wissenschaft Weltoffen kompakt, 2019, Abb. 24 & 27, zum Zeitpunkt der Drucklegung noch unveröffentlicht
Chart 24: Gastwissenschaftleraustausch zwischen Deutschland und anderen Ländern
Obere Grafik:
•DAAD, Wissenschaft Weltoffen kompakt, 2018, Abb. 29, Link: http://www.wissenschaftweltoffen.de/kompakt/wwo2018_kompakt_de.pdf, zuletzt abgerufen am 29.01.2019
Untere Grafik:
•DAAD, Wissenschaft Weltoffen, 2018, S. 119 & 136, Link: http://www.wissenschaftweltoffen.de/publikation/wiwe_2018_verlinkt.pdf, zuletzt abgerufen am 29.01.2019
Chart 25: Staat und Hochschule − Zuständigkeiten, Steuerung und Zusammenwirken
Deutscher Akademischer Austauschdienst, Abteilung Strategie: Eigene Darstellung
Chart 26: Die duale Finanzierung der Hochschulforschung
Obere, linke Grafik: Forschungsbudget der Hochschulen
•Bundesministerium für Bildung und Forschung, Bundesbericht Forschung und Innovation 2018, Forschungs- und innovationspolitische Ziele und Maßnahmen, S. 70, Link: https://www.bmbf.de/pub/Bufi_2018_Hauptband.pdf, zuletzt abgerufen am 08.11.2018
Obere, rechte Grafik: Trägermittel und Drittmittel
•Statistisches Bundesamt, Bildung und Kultur, Finanzen an Hochschulen, Fachserie 11, Reihe 4.5 – 2016, S. 18, Link: https://www.destatis.de/DE/Publikationen/Thematisch/BildungForschungKultur/BildungKulturFinanzen/FinanzenHochschulen2110450167004.pdf?__blob=publicationFile, zuletzt abgerufen am 09.11.2018
Untere Grafik: Drittmittel 2016
•Statistisches Bundesamt, Bildung und Kultur, Finanzen an Hochschulen, Fachserie 11, Reihe 4.5 – 2016, S. 28, Link: https://www.destatis.de/DE/Publikationen/Thematisch/BildungForschungKultur/BildungKulturFinanzen/FinanzenHochschulen2110450167004.pdf?__blob=publicationFile, zuletzt abgerufen am 09.11.2018
Chart 27: Die deutsche Forschungslandschaft und ihre Finanzierung
Obere Grafik: Finanzierende und durchführende Sektoren:
•Statistisches Bundesamt, Bildungsausgaben, Budget für Bildung, Forschung und Wissenschaft 2015/16 (Ausgabe 2018), S. 15, Link: https://www.destatis.de/DE/Publikationen/Thematisch/BildungForschungKultur/BildungKulturFinanzen/BildungsausgabenPDF_5217108.pdf?__blob=publicationFile, zuletzt abgerufen am 08.11.2018
•Finanzen
•Bundesministerium für Bildung und Forschung, Bundesbericht Forschung und Innovation 2018, Forschungs- und innovationspolitische Ziele und Maßnahmen, Link: https://www.bmbf.de/pub/Bufi_2018_Hauptband.pdf, zuletzt abgerufen am 08.11.2018
•Personal: Wirtschaft (S. 23), Hochschule und außeruniversitärer Sektor (S. 24)
•Bundesministerium für Bildung und Forschung, Daten und Fakten zum deutschen Forschungs- und Innovationssystem, Datenband Bundesbericht Forschung und Innovation 2018, Link: https://www.bmbf.de/pub/Bufi_2018_Datenband.pdf, zuletzt abgerufen am 08.11.2018
•Gesamtpersonal: S. 72
Untere Grafik: Forschungsförderung von Bund und Ländern 2017 (Soll in Mio/€)
•Bundesministerium für Bildung und Forschung, Daten und Fakten zum deutschen Forschungs- und Innovationssystem, Datenband Bundesbericht Forschung und Innovation 2018, S. 18,
Link: https://www.bmbf.de/pub/Bufi_2018_Datenband.pdf, zuletzt abgerufen am 08.11.2018
Chart 28: Die Exzellenzstrategie
•Deutsche Forschungsgemeinschaft (DFG) und Wissenschaftsrat (WR), 2018, Förderung der neuen Exzellencluster (EXC) ab 1. Januar 2019, Entscheidung der Exzellenzkommission vom 27.09.2018, Link: http://www.dfg.de/download/pdf/foerderung/programme/exzellenzstrategie/exstra_entscheidung_exc_180927.pdf
Chart 29: Die Positionierung der deutschen Hochschulen in den einflussreichsten internationalen Hochschulrankings (Top 200)
•www.shanghairanking.com
•www.timeshighereducation.com/world-university-rankings
•www.topuniversities.com/university-rankings
Chart 30: Die Hochschulrektorenkonferenz (HRK)
www.hrk.de
Chart 31: Der Deutsche Akademische Austauschdienst (DAAD)
www.daad.de/jahresbericht
Chart 32: Die Alexander von Humboldt-Stiftung)
www.humboldt-foundation.de/web/publikationen.html
Chart 33: Das Goethe-Institut
www.goethe.de/jahrbuch
Chart 34: Die Deutsche Forschungsgemeinschaft (DFG)
www.dfg.de/dfg_profil/jahresbericht/index.html
Chart 35: Die Max-Planck-Gesellschaft
www.mpg.de/jahresbericht
Chart 36: Die Helmholtz-Gemeinschaft Deutscher Forschungszentren
www.helmholtz.de/aktuell/presse_und_medien/mediathek/jahresbericht/
Chart 37: Die Leibniz-Gemeinschaft
https://www.leibniz-gemeinschaft.de/medien/publikationen/archiv/jahresbericht/
Chart 38: Die Fraunhofer-Gesellschaft
www.fraunhofer.de/de/mediathek/publikationen/fraunhofer-jahresbericht.html

